Market context for this story
Loading quotes…
Informational only — not investment advice. Full markets →
OppHub America Desk · · Source: yahoo-megacap-tickers
Meta Plummets After-Hours on Soaring Expenses (After-Hours)
Related markets
💡 If Meta's expense growth continues to outpace revenue expansion, watch $META+WL for further pressure as profitability concerns could lead to multiple compression.
 $META
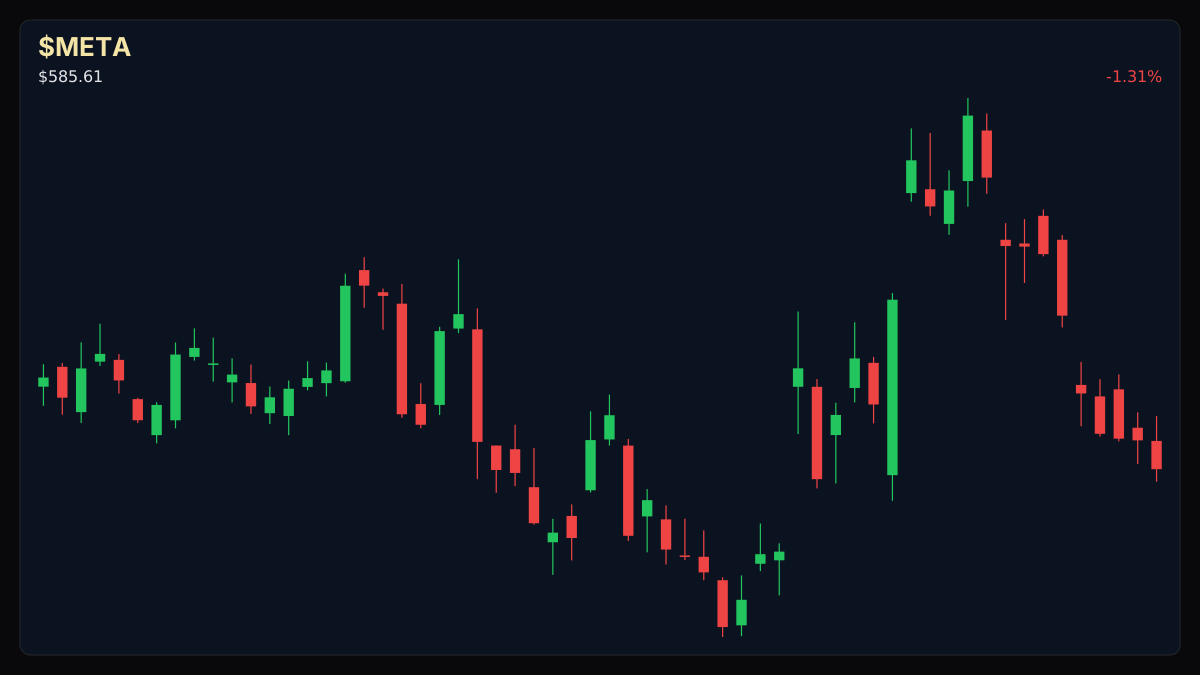
$METALoading chart…
Educational chart — confirm Chart lens on /markets/META. Not investment advice.
Meta Platforms (NASDAQ: META) experienced a significant after-hours decline as a 55% surge in expenses overshadowed record revenue, eroding free cash flow. This operational headwind despite top-line growth highlights increased investment costs impacting profitability.
[MARKET BIAS: BEARISH] [SESSION: AFTER-HOURS] [CATALYST: Expense Surge] **Implied Volatility / Movement:** $META+WL saw after-hours pressure following the report signaling increased investor concern over rising operational costs.
Meta Platforms (NASDAQ: META) faced investor scrutiny in after-hours trading today, Thursday, July 30, 2026, as operational expenses surged by 55%, materially impacting free cash flow despite record revenue. This highlights a clear tradeoff where AI-driven advertising gains are being offset by significant investment outlays.
### Money Play If Meta's expense growth continues to outpace revenue expansion, watch $META+WL for further pressure as profitability concerns could lead to multiple compression.
## Catalyst Analysis: Expense Surge Outpaces Revenue - The print revealed a 55% surge in expenses.
Despite record revenue, Meta's profitability metrics are under pressure due to a substantial increase in operational costs. This 55% expense surge significantly eroded free cash flow to $784 million, signaling that the company's aggressive investments, potentially in AI infrastructure and new product development, are creating a drag on near-term financial performance.
Investors are now assessing whether this elevated spending will yield proportional returns or simply lead to margin compression. The rapid increase in expenses suggests a period of heightened investment, which could depress earnings visibility and valuation multiples if not efficiently translated into future revenue growth.
## $META+WL Technical Analysis & Key Risk Watch Meta's last reported price was $593.87, slightly below its 50-day moving average of $605.62 and well under its 200-day moving average of $637.48. The Relative Strength Index (RSI14) of 44.7 indicates neutral momentum but could turn bearish with continued after-hours selling pressure. Trading volume was 0.58x its 20-day average, suggesting reduced liquidity during the report.
| Level | Price | |:---------------|:------------| | Resistance 2 | N/A | | Resistance 1 | $605.62 (SMA50) | | Current | $593.87 | | Support 1 | N/A | | Support 2 | N/A |
### Sector Ripple / Impact on Technology Sector Increased investment spending by a mega-cap technology leader like Meta could signal that the broader technology sector may also face periods of elevated capital expenditure, potentially impacting the short-term profitability of other large-cap tech companies focused on AI-driven growth.
Based on reporting from yahoo-megacap-tickers.
Read the full story
Original reporting and related coverage — attribution links only, not paid recommendations.
Trade this story
 Robinhood
 Webull
 Tradier
 IBKR
IBKR
Chart this story
 TradingView
Broker and exchange buttons use invite / refer-a-friend links (rewards may be capped). Charting links (TradingView) are partner offers that may pay OppHub America a commission at no extra cost to you.
OppSHOP
Full OppSHOP →As an Amazon Associate, OppHub America earns from qualifying purchases. Shopping here helps keep the site free — at no extra cost to you. Disclosure