Barry, OppHub America Desk · · Source: yahoo-megacap-tickers
Micron Stock Drops 5.9% Amid Profit Surge; Berkshire Gains
No direct investment opportunities were detailed Further analysis would be required to identify specific investment vehicles based on these observations.
Based on reporting from yahoo-megacap-tickers.
Micron Technology's shares fell 5.90% despite a significant surge in earnings, highlighting investor concerns about commodity cycles. Meanwhile, Berkshire Hathaway's stock edged up 0.21%, buoyed by its diversified business and substantial cash reserves.
Market context for this story
As of: WeekendLoading quotes…
Informational only — not investment advice. Full markets →


$BRK.BBerkshire B
TradingView
Live chart & market data via TradingView · OppHub classroom · Delayed or exchange real-time per TradingView data agreements · Not investment advice
Educational TradingView chart — search any symbol in the widget. Confirm on /markets/BRK.B and related $MU, $BYDDF. Not investment advice.
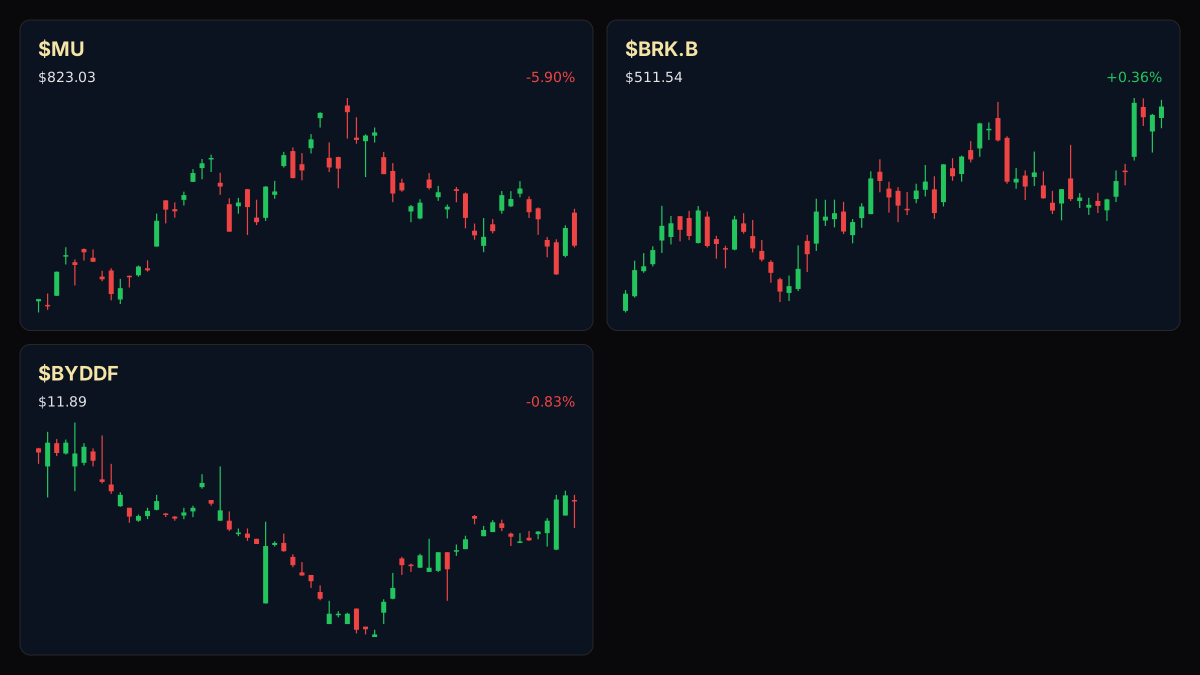
Related markets
Shares a vertical MP4 loop to your phone's camera roll or app share sheet (Instagram, TikTok, Facebook Reels).
Micron Technology (NASDAQ: MU) shares experienced a notable decline of 5.90%, even as the memory chipmaker reported substantial earnings growth. This divergence suggests market participants are weighing the cyclical nature of the semiconductor industry against current profit expansion. Berkshire Hathaway (NYSE: BRK.B), in contrast, saw its shares gain 0.36%, reflecting stability in its diversified conglomerate model. Berkshire's first-quarter operating earnings rose 18% year over year to $11.3 billion, supported by approximately $397 billion in cash and short-term Treasury bills.
### Money Play Watch $BYDDF+WL for potential exposure to the electric vehicle sector, though no direct link to current market action was detailed.
## Catalyst Analysis: Divergent Valuations and Business Models Micron's stock has shed 5.90% of its value, trading near its 52-week low despite reporting significant earnings acceleration. The company posted earnings per share of $24.67 in the third fiscal quarter ending May 28, 2026, with management projecting earnings near $31 in the fourth quarter on projected revenue of $50 billion. This performance stands in contrast to Berkshire Hathaway's steady performance, with its shares up 0.21%, trading at approximately 15 times trailing earnings. Berkshire's substantial cash position and diversified holdings, including insurance and railroad operations, contribute to its perceived stability.
## $MU+WL Technical Analysis & Key Risk Watch
## $BRK.B+WL Technical Analysis & Key Risk Watch Key levels for $BRK.B+WL (educational): R2 $538.42 · R1 $513.39 · last $512.78 · S1 $504.10 · S2 $499.08. Berkshire Hathaway's RSI14 is at 69.3, suggesting the stock is approaching overbought territory, with trading volume at 0.87 times its 20-day average.
### Sector Ripple / Impact on Semiconductors The performance of $MU+WL and $INTC+WL highlights potential shifts in investor sentiment within the semiconductor sector. $INTC+WL last traded at $86.30, down 5.86% on the day, with an RSI14 of 29.6, indicating oversold conditions.
Read the full story
Original reporting and related coverage — attribution links only, not paid recommendations.
Trade this story
 Robinhood
 Webull
 Tradier
 IBKR
IBKR
Chart this story
 TradingView
Broker and exchange buttons use invite / refer-a-friend links (rewards may be capped). Charting links (TradingView) are partner offers that may pay OppHub America a commission at no extra cost to you.
OppSHOP
Full OppSHOP →As an Amazon Associate, OppHub America earns from qualifying purchases. Shopping here helps keep the site free — at no extra cost to you. Disclosure

OppSHOP
Related to this story
No direct investment opportunities were detailed Further analysis would
Shop related →

Investing books
Read the classics
Shop this pick →

Personal finance books
Run the household books
Shop this pick →

Trading notebooks
Write the thesis first
Shop this pick →

Monitor for charts
See every pane
Shop this pick →
Story playbook
A pre-built map of what to watch — stocks, ETFs, and educational next steps. Not personalized advice.
Snapshot date: August 1, 2026 at 9:01 AM ET
This playbook was built when the story published and is not live-updated. Prices, news, and risk can change after this date — treat it as a starting map, not a current trade ticket.
Story → money map
Semiconductor Cyclicality vs Defensive Value
A major memory chip company saw its stock price fall even though it made a lot of money, because investors worry about the ups and downs of the tech market. Meanwhile, a famous holding company went up slightly because it is safe and holds a lot of cash.
What changed
Micron shares fell nearly 6% despite strong earnings due to cyclical industry concerns, while Berkshire Hathaway gained on safe-haven appeal.
Who wins / who loses
Defensive conglomerates and cash-rich holding companies benefit from market caution, whereas cyclical chipmakers face headwinds despite good profits.
Time horizon
Think in terms of the next few weeks.
Confidence & best fit
medium confidence · Long-term investor, Active trader
Safer theme exposure (ETFs)
Baskets that own the theme without betting on one company.
Single stocks (higher risk)
Primary = closest to the story · Peers = same industry · Second-order = knock-on effects · Avoid = looks related but may be a trap
Primary
- $MUWatch — track, don’t rush
Micron's stock dropped even though profits are high, because people worry the good times won't last.
View $MU chart → · End-of-day delayed data
Peer
- $BRK.BBuild slowly — only if it fits your plan
Berkshire Hathaway gained because it is a safe place to park money when other stocks get bumpy.
View $BRK.B chart → · End-of-day delayed data
Options (education only)
No strikes or expiries — a framework for how traders might express the view. Options can expire worthless.
Beginners should skip options here and stick to watching or owning shares slowly.
See options-friendly brokers →Income / OppHub America angle
Not a trade tip — ways to use the insight outside the market.
- Review cash allocation strategies similar to Berkshire Hathaway's treasury reserve approach.
What would break this thesis
- Micron breaking out of its cyclical downtrend with sustained volume.
- Macroeconomic shocks depleting large corporate cash reserves.
What to do next on OppHub America
Saved playbooks stay on this device for now.
Important
Not financial advice. OppHub America playbooks are educational market maps only — not recommendations to buy, sell, or hold any security. Markets move fast; information can be wrong or outdated. Trade and invest at your own risk. Do your own research or consult a licensed advisor.
Based on reporting from yahoo-megacap-tickers.
Informational and educational only — not investment, financial, or legal advice. Disclosure
Shares a vertical MP4 loop to your phone's camera roll or app share sheet (Instagram, TikTok, Facebook Reels).