OppHub America Desk · · Source: yahoo-megacap-tickers
Micron (MU) Stock Pulls Back 23% Below High Amid AI Demand Skepticism
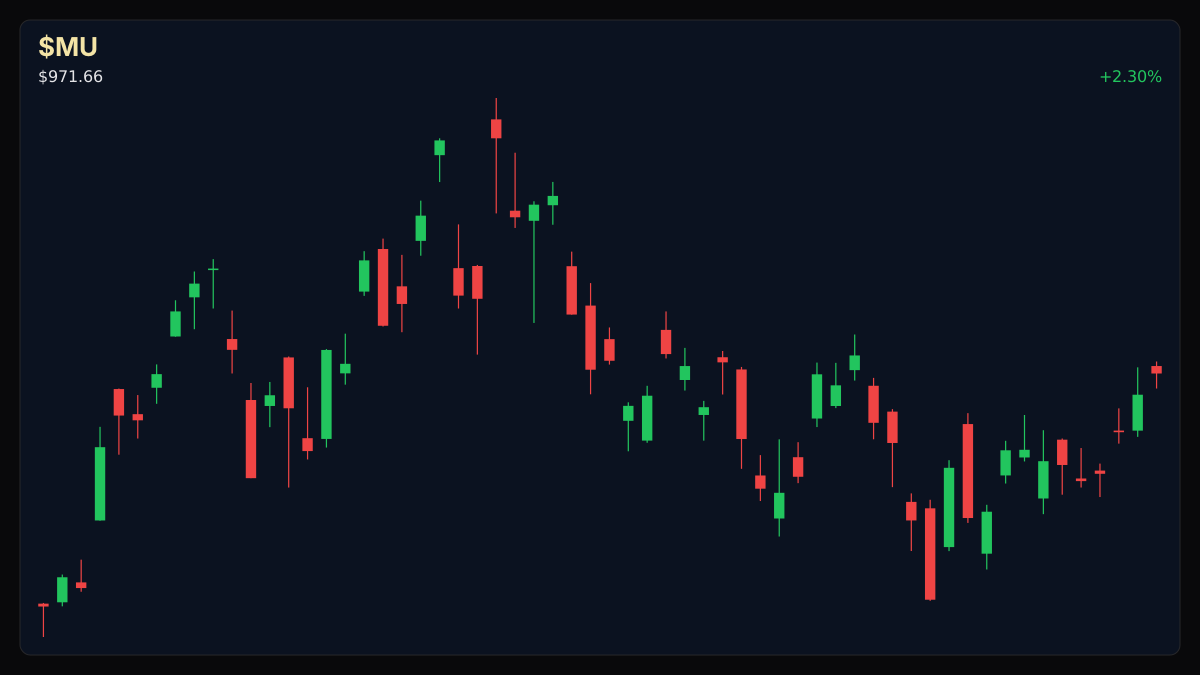
Investors are monitoring Micron Technology to see if the 23% pullback from its 52-week high presents a buying opportunity amid strong demand signals, or if the market is correctly pricing in potential cyclical downturns.
Based on reporting from yahoo-megacap-tickers.
Micron Technology (MU) shares have retreated 23% from their 52-week peak, despite reporting significant revenue and gross margin expansion in its latest fiscal third quarter. The pullback suggests investor skepticism about the sustainability of current AI-driven demand and memory cycle dynamics. Investors are weighing strong operational performance against potential future headwinds.
Market context for this story
As of: WeekendLoading quotes…
Informational only — not investment advice. Full markets →


$MUMicron Technology
TradingView
Live chart & market data via TradingView · OppHub classroom · Delayed or exchange real-time per TradingView data agreements · Not investment advice
Educational TradingView chart — search any symbol in the widget. Confirm on /markets/MU and related $XLI, $XLF. Not investment advice.
Related markets
Shares a vertical MP4 loop to your phone's camera roll or app share sheet (Instagram, TikTok, Facebook Reels).
## Catalyst Analysis: Price Pullback Amid AI Demand Debate
Micron Technology (MU) has seen its stock price decline approximately 23% from its 52-week high, a significant move that has erased over $300 billion in market value from its peak. This drawdown occurs despite the memory chip maker reporting substantial year-over-year growth in its fiscal third quarter, with revenue reaching $41.5 billion, a 346% increase. Gross margins also saw a dramatic expansion, reaching 84.6% from 37.7% in the same period.
The recent price action indicates that the market is questioning the durability of the current AI-driven demand cycle. While Micron's financial performance, particularly in its data-center focused segments, has been robust, the stock's valuation and recent retreat suggest investor caution regarding the sustainability of these elevated levels. Management has guided for fiscal fourth-quarter revenue of $50 billion and a gross margin of approximately 86%, which would represent new company records if achieved.
The skepticism surrounding the stock's valuation, trading at roughly 22 times earnings, appears to stem from historical memory cycle patterns. Investors are anticipating a potential moderation in demand, leading to the significant pullback from the stock's all-time highs, despite strong reported figures and forward guidance. The current market price may reflect expectations that the current boom in AI-related memory demand may not persist at its current pace.
## $MU+WL Technical Analysis & Key Risk Watch
Key levels for $MU+WL (educational): R2 $902.43 · R1 $882.50 · last $861.00 · S1 $858.90 · S2 $854.35.
### Sector Ripple / Impact on Industrials
Micron Technology (MU) operates within the broader semiconductor and technology sectors. Its performance and market sentiment can influence related companies and investor outlook for the sector. The industrial sector, represented by $XLI+WL, saw a modest uptick, trading at $179.84 with an RSI of 48.5, indicating a neutral stance ahead of further news from key players in the tech supply chain. The broader financial sector, tracked by $XLF+WL, traded lower at $56.94 with an RSI of 59, suggesting a slightly more positive but cautious sentiment.
Read the full story
Original reporting and related coverage — attribution links only, not paid recommendations.
Trade this story
 Robinhood
 Webull
 Tradier
 IBKR
IBKR
Chart this story
 TradingView
Broker and exchange buttons use invite / refer-a-friend links (rewards may be capped). Charting links (TradingView) are partner offers that may pay OppHub America a commission at no extra cost to you.
OppSHOP
Full OppSHOP →As an Amazon Associate, OppHub America earns from qualifying purchases. Shopping here helps keep the site free — at no extra cost to you. Disclosure

OppSHOP
Related to this story
Investors are monitoring Micron Technology to see if the 23% pullback fr
Shop related →

Investing books
Read the classics
Shop this pick →

Personal finance books
Run the household books
Shop this pick →

Trading notebooks
Write the thesis first
Shop this pick →

Monitor for charts
See every pane
Shop this pick →
Based on reporting from yahoo-megacap-tickers.
Informational and educational only — not investment, financial, or legal advice. Disclosure
Shares a vertical MP4 loop to your phone's camera roll or app share sheet (Instagram, TikTok, Facebook Reels).