Barry, OppHub America Desk · · Source: yahoo-tickers-tape-movers
Microsoft Valuation: DCF Models Point to US$555.8 Target After 74% Run
If discounted cash flow models and revenue run rates sustain higher future cash generation for , watch for potential multiple expansion or momentum continuation; track related large-cap technology vehicles for broader sector participation.
Based on reporting from yahoo-tickers-tape-movers.
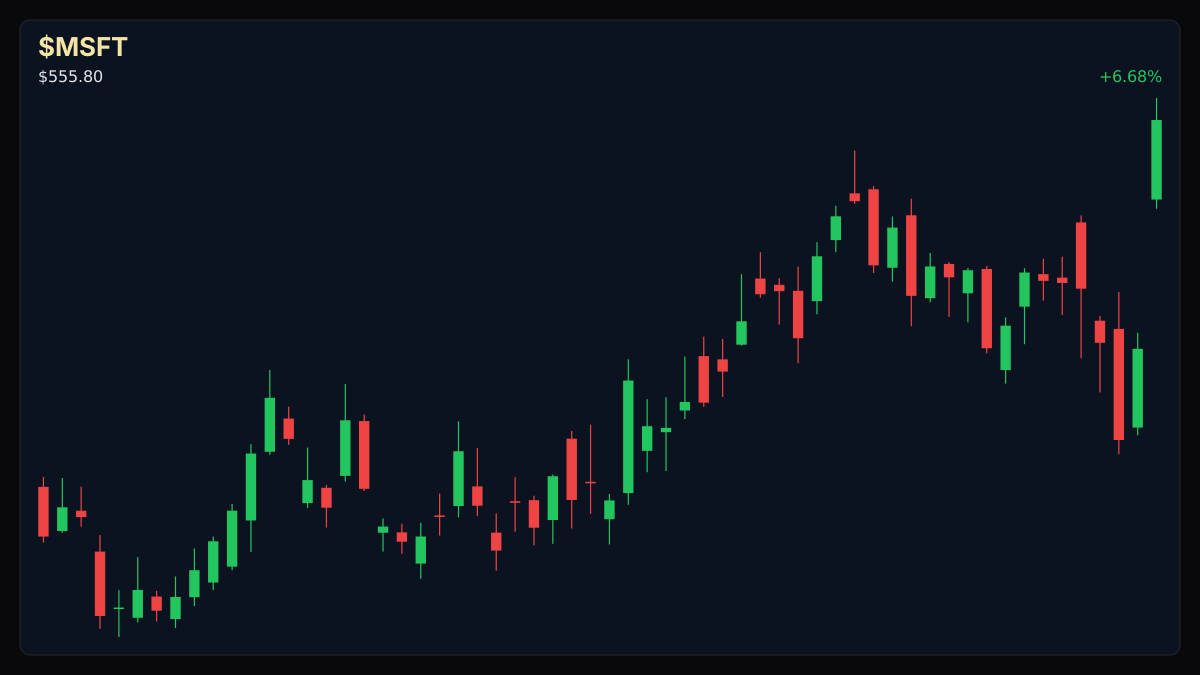
Microsoft (NASDAQ: MSFT) sits near record territory following a 74.2% five-year return, as discounted cash flow models and heavy AI capital expenditures spark debate over whether intrinsic value supports a US$555.80 share price. Thursday disclosures highlight robust free cash flow generation paired with billions in bond issuance to fund expanding infrastructure.
Market context for this story
As of: After HoursLoading quotes…
Informational only — not investment advice. Full markets →

$MSFTCloud Infrastructure
TradingView
Live chart & market data via TradingView · OppHub classroom · Delayed or exchange real-time per TradingView data agreements · Not investment advice
Educational TradingView chart — search any symbol in the widget. Confirm on /markets/MSFT. Not investment advice.
Related markets
Shares a vertical MP4 loop to your phone's camera roll or app share sheet (Instagram, TikTok, Facebook Reels).
Microsoft (NASDAQ: MSFT) sits near record territory following a 74.2% five-year return, as discounted cash flow models and heavy AI capital expenditures spark debate over whether intrinsic value supports a US$555.80 share price. Thursday disclosures highlight robust free cash flow generation paired with billions in bond issuance to fund expanding infrastructure.
### Catalyst Analysis: Valuation and Cash Flow Projections - **Discounted Cash Flow Model:** Intrinsic value estimates lean on latest twelve-month free cash flow of approximately $97.3b and projected expansion, supporting an estimated share price of about US$555.80. - **Capital Allocation:** Recent funding initiatives, including a $25b bond raise for AI infrastructure, elevate both future capital expenditure requirements and potential cash generation profiles. - **Market Divergence:** Community and analyst perspectives remain split, with bull cases citing a 12% undervaluation driven by annualized AI revenue run rates above US$37b and bear cases warning that optimistic assumptions are already priced in.
### Impact on Mapped Tickers / Sectors - **Software & Cloud Infrastructure ($MSFT+WL):** Institutional participants weigh high-intensity usage across Copilot, GitHub Copilot, and Dynamics 365 agents against the drag of heavy capital outlays. - **Related Markets:** Broad technology indices experience sentiment shifts as mega-cap infrastructure spend and bond issuance volumes influence tech sector tape flow.
### Winners, Negatives & Uncertainty - **Upside Drivers:** Accelerated enterprise cloud adoption and robust software monetization validate higher usage intensity and margin expansion. - **Downside Risks:** Massive capital expenditure requirements raise the execution bar for free cash flow generation, while valuation multiples near 28.9x P/E leave little room for operational missteps. - **Uncertainty:** Disparate valuation narratives highlight ongoing debate over whether intrinsic value models adequately price long-term AI infrastructure costs.
### Risk Watch — Legal, Financial, and Execution Timelines - **Execution Hurdles:** Monitor data center buildout timelines and return on invested capital as multi-billion-dollar bond proceeds deploy. - **Valuation Sensitivity:** Track shifts in free cash flow assumptions and discount rates that drive intrinsic value variances.
### Story Arc / How We Got Here Building on earlier institutional evaluations of artificial intelligence positioning and enterprise cloud adoption during Microsoft's late October disclosures (previously covered at OppHub Markets in our [Microsoft Key Earnings Coverage](/explore/microsoft-key-earnings-loom-as-market-eyes-ai-position)), current tape flow continues to focus on how sustained AI capital outlays translate into durable free cash flow generation.
### Money Play - If discounted cash flow models and AI revenue run rates sustain higher future cash generation for $MSFT+WL, watch for potential multiple expansion or momentum continuation; track related large-cap technology vehicles for broader sector participation.
Read the full story
Original reporting and related coverage — attribution links only, not paid recommendations.
Trade this story (crypto)
 Coinbase
 Gemini
 Robinhood
 Webull
Chart this story
 TradingView
Broker and exchange buttons use invite / refer-a-friend links (rewards may be capped). Charting links (TradingView) are partner offers that may pay OppHub America a commission at no extra cost to you.
OppSHOP
Full OppSHOP →As an Amazon Associate, OppHub America earns from qualifying purchases. Shopping here helps keep the site free — at no extra cost to you. Disclosure

OppSHOP
Related to this story
If discounted cash flow models and revenue run rates sustain higher futu
Shop related →

Investing books
Read the classics
Shop this pick →

Personal finance books
Run the household books
Shop this pick →

Trading notebooks
Write the thesis first
Shop this pick →

Monitor for charts
See every pane
Shop this pick →
Story playbook
A pre-built map of what to watch — stocks, ETFs, and educational next steps. Not personalized advice.
Snapshot date: November 5, 2026 at 2:31 AM ET
This playbook was built when the story published and is not live-updated. Prices, news, and risk can change after this date — treat it as a starting map, not a current trade ticket.
Story → money map
AI Infrastructure Valuation
Microsoft shares have gone up a lot recently, and financial experts are arguing over whether the company is actually worth an even higher price tag. People who manage money are watching closely to see if Microsoft's heavy spending on artificial intelligence will pay off or slow them down.
What changed
Discounted cash flow models and heavy AI capital expenditures have sparked debate over Microsoft's intrinsic value and potential path to a US$555.80 share target.
Who wins / who loses
AI infrastructure providers and software leaders benefit from strong adoption, while cautious investors worry that heavy bond-funded capital outlays are fully priced in.
Time horizon
Think in terms of the next few months.
Confidence & best fit
medium confidence · Long-term investor
Safer theme exposure (ETFs)
Baskets that own the theme without betting on one company.
Single stocks (higher risk)
Primary = closest to the story · Peers = same industry · Second-order = knock-on effects · Avoid = looks related but may be a trap
Primary
- $MSFTWatch — track, don’t rush
Microsoft is the main stock in question as experts debate if its huge spending on artificial intelligence makes it worth an even higher price.
View $MSFT chart → · End-of-day delayed data
Peer
- $GOOGLWatch — track, don’t rush
Other giant technology companies spending heavily on artificial intelligence will feel similar market pressure.
View $GOOGL chart → · End-of-day delayed data
- $AMZNWatch — track, don’t rush
Amazon's cloud computing division is in a similar race to build out expensive data centers.
View $AMZN chart → · End-of-day delayed data
Options (education only)
No strikes or expiries — a framework for how traders might express the view. Options can expire worthless.
Beginners should skip complex options here and stick to watching the stock or using diversified funds.
See options-friendly brokers →Income / OppHub America angle
Not a trade tip — ways to use the insight outside the market.
- Monitor enterprise software adoption trends and corporate cloud spending reports.
What would break this thesis
- A significant drop in free cash flow generation or a slowdown in annualized AI revenue run rates.
What to do next on OppHub America
Saved playbooks stay on this device for now.
Important
Not financial advice. OppHub America playbooks are educational market maps only — not recommendations to buy, sell, or hold any security. Markets move fast; information can be wrong or outdated. Trade and invest at your own risk. Do your own research or consult a licensed advisor.
Based on reporting from yahoo-tickers-tape-movers.
Informational and educational only — not investment, financial, or legal advice. Disclosure
Shares a vertical MP4 loop to your phone's camera roll or app share sheet (Instagram, TikTok, Facebook Reels).