Barry, OppHub America Desk · · Source: yahoo-tickers-tape-movers
Midterm Elections 2026: Historical Odds and Stock Market Impact
Political shifts and fiscal policy changes historically drive macro volatility across major equities and fixed-income portfolios; monitor legislative probabilities as election day approaches.
Based on reporting from yahoo-tickers-tape-movers.
With midterm elections exactly one month away from Saturday, October 3, 2026, historical market performance under different congressional outcomes takes center stage for Wall Street. Investors analyze historical averages for major indexes including the Dow Jones Industrial Average, S&P 500, and Nasdaq Composite as political probabilities shift.
Market context for this story
As of: WeekendLoading quotes…
Informational only — not investment advice. Full markets →
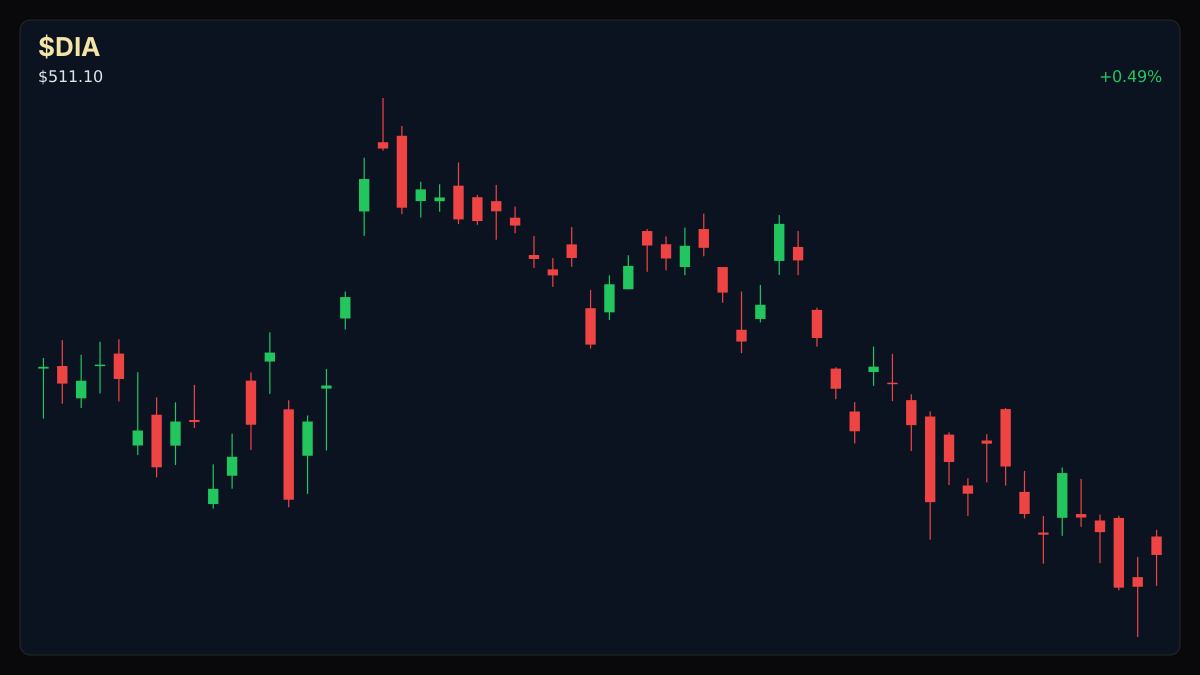
 SPDR Dow Jones ETF·$DIA
$DIASPDR Dow Jones ETF
TradingView
Live chart & market data via TradingView · OppHub classroom · Delayed or exchange real-time per TradingView data agreements · Not investment advice
Educational TradingView chart — search any symbol in the widget. Confirm on /markets/DIA. Not investment advice.
Related markets
Shares a vertical MP4 loop to your phone's camera roll or app share sheet (Instagram, TikTok, Facebook Reels).
### Session Tape — Weekend Outlook - Dow Jones Industrial Average (^DJI): +0.49% - S&P 500 (^GSPC): +0.73% - Nasdaq Composite (^IXIC): +1.19%
## Catalyst Analysis: Electoral History Meets Wall Street As the calendar turns to Saturday, October 3, 2026, market participants are weighing the historical implications of upcoming congressional composition shifts. While broad index returns under various presidential administrations have shown notable resilience—including gains for the Dow Jones Industrial Average (^DJI), S&P 500 (^GSPC), and Nasdaq Composite (^IXIC)—legislative control heavily dictates fiscal policy execution. Data as of late September outlines distinct probability spreads across political outcomes, influencing sector positioning as election day approaches.
## Historical Returns and Fiscal Policy Risks Corporate tax policy remains a cornerstone of equity valuations, tracing back to structural adjustments such as the reduction of the marginal corporate income tax rate from 35% to 21%. Historical precedents indicate that divided government structures or shifting majorities can alter fiscal momentum, impacting long-term capital expenditure and portfolio diversification strategies for market participants.
### Money Play - Political shifts and fiscal policy changes historically drive macro volatility across major equities and fixed-income portfolios; monitor legislative probabilities as election day approaches.
Read the full story
Original reporting and related coverage — attribution links only, not paid recommendations.
Trade this story
 Robinhood
 Webull
 Tradier
 IBKR
IBKR
Chart this story
 TradingView
Broker and exchange buttons use invite / refer-a-friend links (rewards may be capped). Charting links (TradingView) are partner offers that may pay OppHub America a commission at no extra cost to you.
OppSHOP
Full OppSHOP →As an Amazon Associate, OppHub America earns from qualifying purchases. Shopping here helps keep the site free — at no extra cost to you. Disclosure

OppSHOP
Related to this story
Political shifts and fiscal policy changes historically drive macro vola
Shop related →

Investing books
Read the classics
Shop this pick →

Personal finance books
Run the household books
Shop this pick →

Trading notebooks
Write the thesis first
Shop this pick →

Monitor for charts
See every pane
Shop this pick →
Story playbook
A pre-built map of what to watch — stocks, ETFs, and educational next steps. Not personalized advice.
Snapshot date: October 3, 2026 at 9:56 AM ET
This playbook was built when the story published and is not live-updated. Prices, news, and risk can change after this date — treat it as a starting map, not a current trade ticket.
Story → money map
Electoral policy macro impact
As the midterm elections get closer, investors are looking at history to see how changes in government control might affect the stock market. Because politicians make the rules on taxes and spending, Wall Street pays close attention to who might win.
What changed
Approaching the 2026 midterm elections, investors are recalibrating portfolios based on historical market trends under various congressional power distributions.
Who wins / who loses
Broad market index funds generally benefit from historical post-election stability, while single sectors sensitive to abrupt tax or fiscal policy shifts face heightened volatility.
Time horizon
Think in terms of the next few months.
Confidence & best fit
medium confidence · Long-term investor, Active trader
Safer theme exposure (ETFs)
Baskets that own the theme without betting on one company.
Single stocks (higher risk)
Primary = closest to the story · Peers = same industry · Second-order = knock-on effects · Avoid = looks related but may be a trap
Primary
- $DIAWatch — track, don’t rush
Tracks a basket of major traditional companies that often react to government tax and spending rules.
View $DIA chart → · End-of-day delayed data
Options (education only)
No strikes or expiries — a framework for how traders might express the view. Options can expire worthless.
Options can be complex and risky during political events; beginners are generally better off sticking to standard stock or ETF investing.
See options-friendly brokers →Income / OppHub America angle
Not a trade tip — ways to use the insight outside the market.
- Review personal portfolio diversification across different sectors to prepare for potential regulatory or tax policy changes.
What would break this thesis
- Sudden bipartisan fiscal agreements that remove political uncertainty or major unexpected macroeconomic shocks overriding election outcomes.
What to do next on OppHub America
Saved playbooks stay on this device for now.
Important
Not financial advice. OppHub America playbooks are educational market maps only — not recommendations to buy, sell, or hold any security. Markets move fast; information can be wrong or outdated. Trade and invest at your own risk. Do your own research or consult a licensed advisor.
Based on reporting from yahoo-tickers-tape-movers.
Informational and educational only — not investment, financial, or legal advice. Disclosure
Shares a vertical MP4 loop to your phone's camera roll or app share sheet (Instagram, TikTok, Facebook Reels).