Barry, OppHub America Desk · · Source: investing-com-stocks
Midterm Elections and Equity Markets: Historical S&P 500 Trends
Energy & climate policy: Lease, export, , and subsidy shifts move energy equities fast.
Based on reporting from investing-com-stocks.
As investors evaluate historical equity positioning around election cycles, historical S&P 500 data from UBS strategists highlights median seasonal returns alongside shifting political probabilities. Understanding these historical patterns helps traders navigate volatility as macroeconomic and legislative expectations adjust.
Market context for this story
As of: WeekendLoading quotes…
Informational only — not investment advice. Full markets →
 SPDR S&P 500 ETF·$SPY
$SPYSPDR S&P 500 ETF
TradingView
Live chart & market data via TradingView · OppHub classroom · Delayed or exchange real-time per TradingView data agreements · Not investment advice
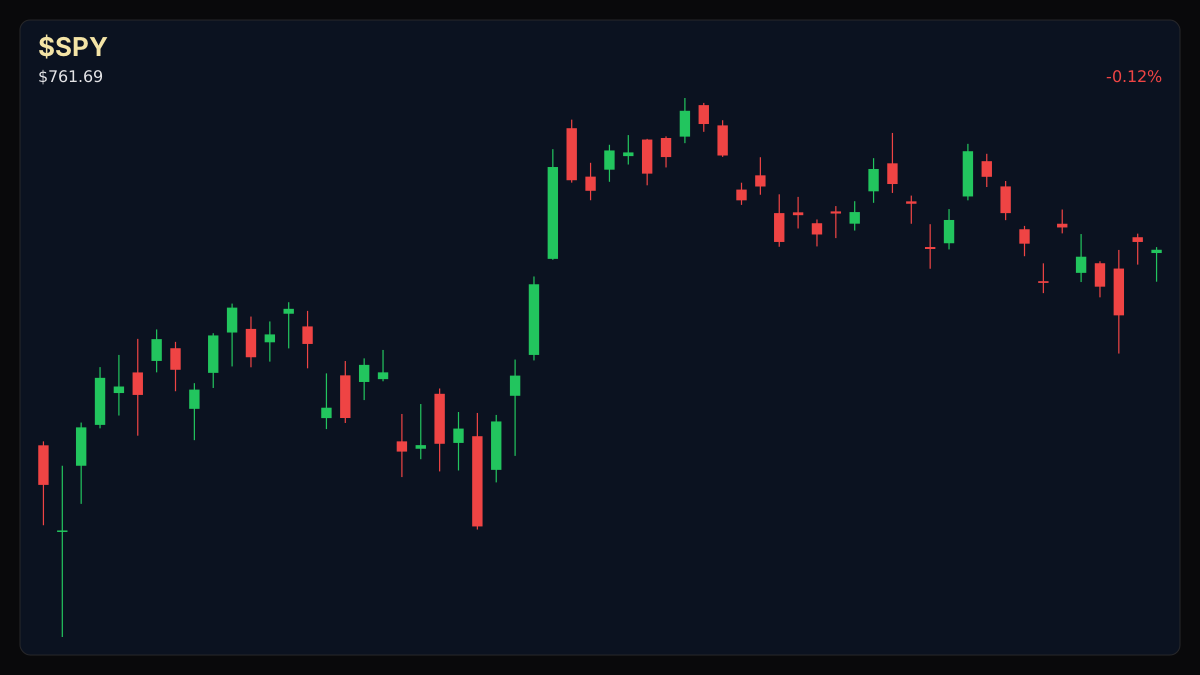
Educational TradingView chart — search any symbol in the widget. Confirm on /markets/SPY. Not investment advice.
Related markets
Shares a vertical MP4 loop to your phone's camera roll or app share sheet (Instagram, TikTok, Facebook Reels).
### Session Tape — Weekend Positioning - Equity desks review historical election-year trends alongside broader macroeconomic positioning as markets prepare for upcoming legislative shifts.
## Catalyst Analysis: Historical S&P 500 Performance Around Midterms Historical data compiled by UBS strategists illustrates distinct seasonal patterns for the S&P 500 during election cycles. According to the findings, the index has recorded a median decline of 1.4% from the end of August through early October, followed by historical strength into year-end and the following spring. Specifically, the S&P 500 has averaged about a 6% gain from September through year-end, while gains from the end of August through the end of the year have averaged 14.5% with a median return of 16.4%. Furthermore, historical returns through the following March have averaged approximately 14%, though individual cycles have exhibited negative phases.
## Market Implications & Legislative Probabilities Market participants continue to monitor shifting political probabilities, including indicators pointing to Democrats holding an implied probability above 85% of taking the House in certain scenarios. As policy expectations evolve, equity strategists emphasize historical seasonality rather than speculative outcomes, maintaining a disciplined focus on broader index levels and risk management.
### Money Play No specific individual equities or tickers are mentioned in the verified factual record for this macro review. Investors tracking broader market cycles should observe seasonal S&P 500 positioning and incoming legislative developments.
Read the full story
Original reporting and related coverage — attribution links only, not paid recommendations.
Trade this story
 Robinhood
 Webull
 Tradier
 IBKR
IBKR
Chart this story
 TradingView
Broker and exchange buttons use invite / refer-a-friend links (rewards may be capped). Charting links (TradingView) are partner offers that may pay OppHub America a commission at no extra cost to you.
OppSHOP
Full OppSHOP →As an Amazon Associate, OppHub America earns from qualifying purchases. Shopping here helps keep the site free — at no extra cost to you. Disclosure

OppSHOP
Related to this story
Energy & climate policy: Lease, export, , and subsidy shifts move energy
Shop related →

Investing books
Read the classics
Shop this pick →

Personal finance books
Run the household books
Shop this pick →

Trading notebooks
Write the thesis first
Shop this pick →

Monitor for charts
See every pane
Shop this pick →
Story playbook
A pre-built map of what to watch — stocks, ETFs, and educational next steps. Not personalized advice.
Snapshot date: September 20, 2026 at 6:27 PM ET
This playbook was built when the story published and is not live-updated. Prices, news, and risk can change after this date — treat it as a starting map, not a current trade ticket.
Story → money map
Election seasonality and policy shifts
Stock market historians point out that stocks usually dip in late summer during election years before bouncing back strongly toward the end of the year. Investors pay attention to this because changes in government control can quickly affect energy and business rules.
What changed
UBS seasonal data highlights historical S&P 500 trends around midterms, showing a typical late-summer pullback followed by strong year-end gains.
Who wins / who loses
Broad index investors and diversified funds historically benefit from end-of-year rallies, while over-concentrated speculative bets can get caught in pre-election policy volatility.
Time horizon
Think in terms of the next few months.
Confidence & best fit
medium confidence · Long-term investor
Safer theme exposure (ETFs)
Baskets that own the theme without betting on one company.
Single stocks (higher risk)
Primary = closest to the story · Peers = same industry · Second-order = knock-on effects · Avoid = looks related but may be a trap
Primary
- $XLEWatch — track, don’t rush
Energy stocks are sensitive to government policy changes and elections.
View $XLE chart → · End-of-day delayed data
- $SPYBuild slowly — only if it fits your plan
The main stock market index historically performs well after late-summer election-year dips.
View $SPY chart → · End-of-day delayed data
Options (education only)
No strikes or expiries — a framework for how traders might express the view. Options can expire worthless.
Beginners should skip options here and simply watch for normal market dips.
See options-friendly brokers →Income / OppHub America angle
Not a trade tip — ways to use the insight outside the market.
- Review portfolio asset allocation ahead of projected autumn volatility.
What would break this thesis
- Unexpected macroeconomic shocks or aggressive monetary policy changes overriding historical seasonal trends.
What to do next on OppHub America
Saved playbooks stay on this device for now.
Important
Not financial advice. OppHub America playbooks are educational market maps only — not recommendations to buy, sell, or hold any security. Markets move fast; information can be wrong or outdated. Trade and invest at your own risk. Do your own research or consult a licensed advisor.
Based on reporting from investing-com-stocks.
Informational and educational only — not investment, financial, or legal advice. Disclosure
Shares a vertical MP4 loop to your phone's camera roll or app share sheet (Instagram, TikTok, Facebook Reels).