OppHub America Desk · · Source: yahoo-tickers-tape-movers
Monster Beverage Brand Strength and Market Moat Drive Revenue
Housing & mortgages: Rate and housing policy spill into builders, small-caps, and REITs.
Based on reporting from yahoo-tickers-tape-movers.
Monster Beverage posted $8 billion in revenue for 2025 alongside 202% second-quarter revenue growth to $2.5 billion, underscoring how brand equity and shelf presence protect its energy drink business against competition.
Market context for this story
As of: WeekendLoading quotes…
Informational only — not investment advice. Full markets →
 Monster Beverage·$MNST
$MNSTMonster Beverage
TradingView
Live chart & market data via TradingView · OppHub classroom · Delayed or exchange real-time per TradingView data agreements · Not investment advice
Educational TradingView chart — search any symbol in the widget. Confirm on /markets/MNST. Not investment advice.
Related markets
Shares a vertical MP4 loop to your phone's camera roll or app share sheet (Instagram, TikTok, Facebook Reels).
Monster Beverage demonstrated robust financial performance as brand loyalty and distribution moats reinforced its market position in the energy drink sector.
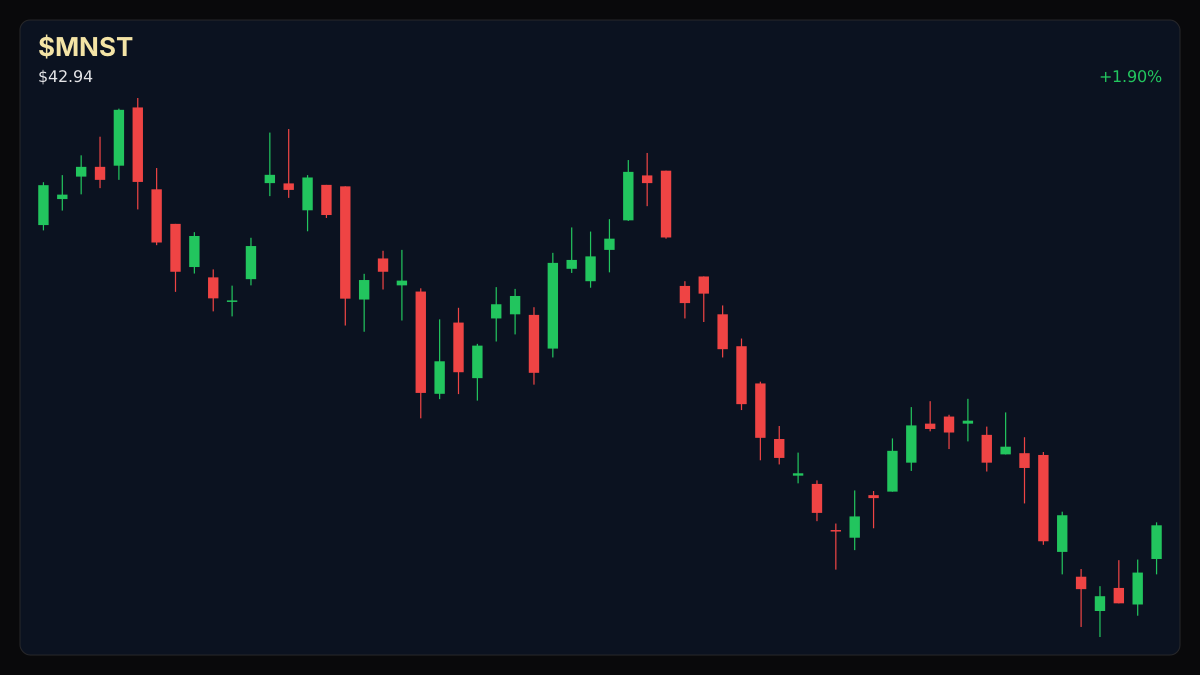
### Session Tape - Monster Beverage (MNST): +1.90% ($0.80) at $42.94, trading within a day's range of $42.11 to $42.98.
## Catalyst Analysis: Brand Equity and Scale While competitor formulations in the energy drink space—from Red Bull to Celsius—remain accessible, Monster Beverage generated $8 billion in revenue during 2025. During the second quarter of 2026, revenue expanded by 20.2% to $2.5 billion, while net income increased 19.6% to $584.5 million. Rather than resting solely on product ingredients, the enterprise moat derives from decades of brand recognition, distinctive packaging, and deep marketing alignment with motorsports, gaming, and music, securing critical retail shelf space against challengers.
## $MNST+WL Technical Analysis & Key Risk Watch
Trading at $42.94 with a 52-week range spanning $32.94 to $50.17, equity momentum reflects steady accumulation on 7.7 million volume compared to a 10.6 million average volume baseline. Gross margins stand at 55.55%, providing operational cushion against supply chain volatility. Traders monitor whether sustained volume can breach the upper boundaries of the current daily session range.
Read the full story
Original reporting and related coverage — attribution links only, not paid recommendations.
Trade this story
 Robinhood
 Webull
 Tradier
 IBKR
IBKR
Chart this story
 TradingView
Broker and exchange buttons use invite / refer-a-friend links (rewards may be capped). Charting links (TradingView) are partner offers that may pay OppHub America a commission at no extra cost to you.
OppSHOP
Full OppSHOP →As an Amazon Associate, OppHub America earns from qualifying purchases. Shopping here helps keep the site free — at no extra cost to you. Disclosure

OppSHOP
Related to this story
Housing & mortgages: Rate and housing policy spill into builders, small-
Shop related →

Investing books
Read the classics
Shop this pick →

Personal finance books
Run the household books
Shop this pick →

Trading notebooks
Write the thesis first
Shop this pick →

Monitor for charts
See every pane
Shop this pick →
Based on reporting from yahoo-tickers-tape-movers.
Informational and educational only — not investment, financial, or legal advice. Disclosure
Shares a vertical MP4 loop to your phone's camera roll or app share sheet (Instagram, TikTok, Facebook Reels).