Barry, OppHub America Desk · · Source: yahoo-tickers-rotation
Nasdaq-100 Dot-Com Peak History: $10k to $72k Long-Term Return
Long-term index studies highlight historical patience through multi-year drawdowns.
Based on reporting from yahoo-tickers-rotation.
Purchasing the Invesco QQQ Trust at its March 27, 2000 closing peak of $117.75 tested long-term conviction before compounding to approximately $72,000 with dividends reinvested over two and a half decades. Historical perspective demonstrates how prolonged drawdowns eventually yielded positive annualized returns for patient capital.
Market context for this story
As of: WeekendLoading quotes…
Informational only — not investment advice. Full markets →
 Invesco QQQ Trust·$QQQ
$QQQInvesco QQQ Trust
TradingView
Live chart & market data via TradingView · OppHub classroom · Delayed or exchange real-time per TradingView data agreements · Not investment advice
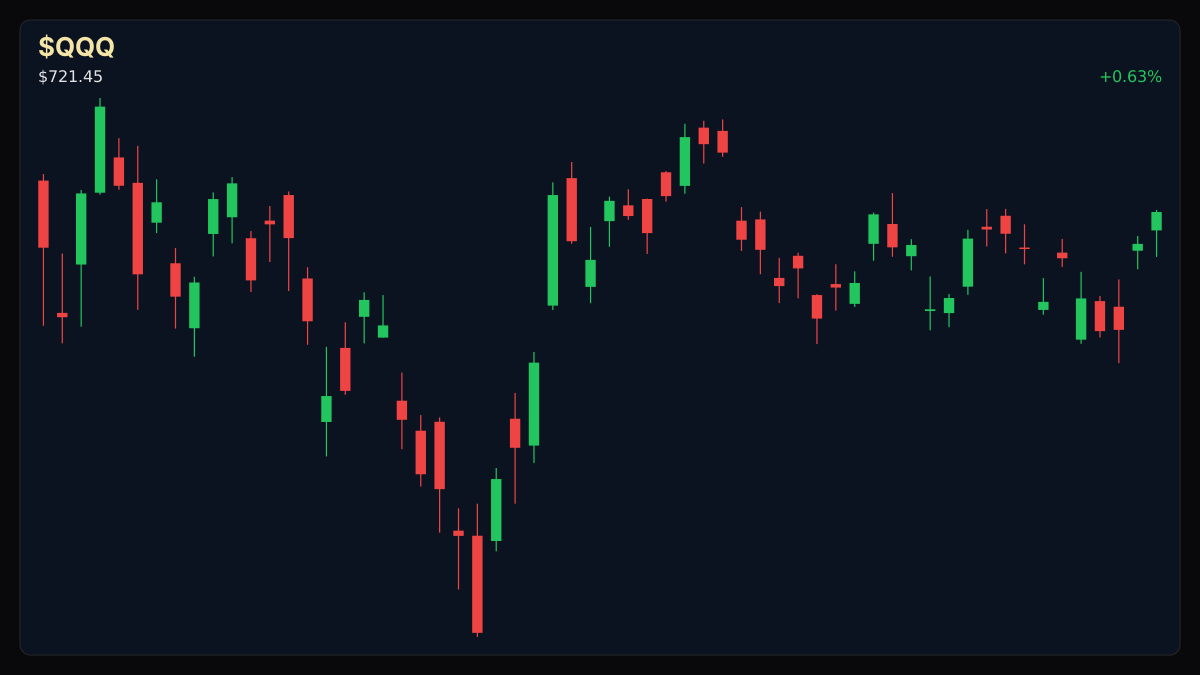
Educational TradingView chart — search any symbol in the widget. Confirm on /markets/QQQ. Not investment advice.
Related markets
Shares a vertical MP4 loop to your phone's camera roll or app share sheet (Instagram, TikTok, Facebook Reels).
### Session Tape — Weekend Index Review - Historical analysis of the March 27, 2000 Invesco $QQQ+WL Trust peak ($117.75) and subsequent Oct. 9, 2002 low ($20.06).
## Catalyst Analysis: Historical Dot-Com Peak Resilience Reviewing historical index milestones reveals the extreme volatility endured by long-term investors following the March 2000 tech bubble top. The Nasdaq-100 index peak on March 27, 2000, marked the beginning of an 83% drawdown to the October 2002 trough. Despite a multi-year recovery period where the fund did not close above its initial peak for over 16 years, a $10,000 lump-sum allocation with dividends reinvested ultimately expanded to roughly $72,000, representing an annualized return of about 7.8% over the period.
## Technical Analysis & Key Risk Watch
Market participants evaluating historical index benchmarks monitor broad participation metrics and valuation cycles to navigate potential sentiment extremes. Historical drawdowns emphasize the critical role of time horizon and risk management during structural market shifts.
### Money Play Historical index analysis underscores the compounding effect of long-term holding periods through major macroeconomic cycles.
Read the full story
Original reporting and related coverage — attribution links only, not paid recommendations.
Trade this story
 Robinhood
 Webull
 Tradier
 IBKR
IBKR
Chart this story
 TradingView
Broker and exchange buttons use invite / refer-a-friend links (rewards may be capped). Charting links (TradingView) are partner offers that may pay OppHub America a commission at no extra cost to you.
OppSHOP
Full OppSHOP →As an Amazon Associate, OppHub America earns from qualifying purchases. Shopping here helps keep the site free — at no extra cost to you. Disclosure

OppSHOP
Related to this story
Long-term index studies highlight historical patience through multi-year
Shop related →

Investing books
Read the classics
Shop this pick →

Personal finance books
Run the household books
Shop this pick →

Trading notebooks
Write the thesis first
Shop this pick →

Monitor for charts
See every pane
Shop this pick →
Story playbook
A pre-built map of what to watch — stocks, ETFs, and educational next steps. Not personalized advice.
Snapshot date: September 19, 2026 at 10:26 PM ET
This playbook was built when the story published and is not live-updated. Prices, news, and risk can change after this date — treat it as a starting map, not a current trade ticket.
Story → money map
long-term index resilience
Looking back at the 2000 tech bubble peak teaches us that buying at the very worst time can still turn a profit if you hold for decades. Investors care about this because it proves that staying calm through market crashes and reinvesting dividends pays off over the long run.
What changed
A historical performance review of the Invesco QQQ Trust highlights the long-term resilience of major tech indices after extreme drawdowns.
Who wins / who loses
Patient long-term index investors benefit from multi-decade compounding, while panic sellers during the 2000-2002 crash locked in permanent losses.
Time horizon
Think in terms of the next few months.
Confidence & best fit
high confidence · Long-term investor
Safer theme exposure (ETFs)
Baskets that own the theme without betting on one company.
Single stocks (higher risk)
Primary = closest to the story · Peers = same industry · Second-order = knock-on effects · Avoid = looks related but may be a trap
Primary
- $QQQBuild slowly — only if it fits your plan
The main fund tracking the tech index used in this historical study.
View $QQQ chart → · End-of-day delayed data
Peer
- $NVDAWatch — track, don’t rush
A major technology stock watched closely by traders for short-term price moves.
View $NVDA chart → · End-of-day delayed data
Options (education only)
No strikes or expiries — a framework for how traders might express the view. Options can expire worthless.
Beginners should skip options completely here and focus on buying and holding broad index funds over many years.
See options-friendly brokers →Income / OppHub America angle
Not a trade tip — ways to use the insight outside the market.
- Automate regular monthly or quarterly contributions to retirement accounts to average out market volatility.
What would break this thesis
- A structural shift ending multi-decade economic growth or permanent technological stagnation.
What to do next on OppHub America
Saved playbooks stay on this device for now.
Important
Not financial advice. OppHub America playbooks are educational market maps only — not recommendations to buy, sell, or hold any security. Markets move fast; information can be wrong or outdated. Trade and invest at your own risk. Do your own research or consult a licensed advisor.
Based on reporting from yahoo-tickers-rotation.
Informational and educational only — not investment, financial, or legal advice. Disclosure
Shares a vertical MP4 loop to your phone's camera roll or app share sheet (Instagram, TikTok, Facebook Reels).