Barry, OppHub America Desk · · Source: yahoo-tickers-tape-movers
Nasdaq-100 Growth Outlook: Long-Term Returns and Historical QQQ Data
Long-term equity indexing strategies remain sensitive to secular growth trends, valuation compression risks, and alternative asset class performance across multi-decade horizons.
Based on reporting from yahoo-tickers-tape-movers.
Analyzing historical data for the Invesco QQQ Trust and the Nasdaq-100 index reveals long-term annualized growth rates of 20.8% over the past decade, though prospective projections prompt portfolio diversification considerations. Investors examining multi-decade time horizons evaluate how historical compounding shapes future capital allocation.
Market context for this story
As of: PremarketLoading quotes…
Informational only — not investment advice. Full markets →
 Invesco QQQ Trust·$QQQ
$QQQInvesco QQQ Trust
TradingView
Live chart & market data via TradingView · OppHub classroom · Delayed or exchange real-time per TradingView data agreements · Not investment advice
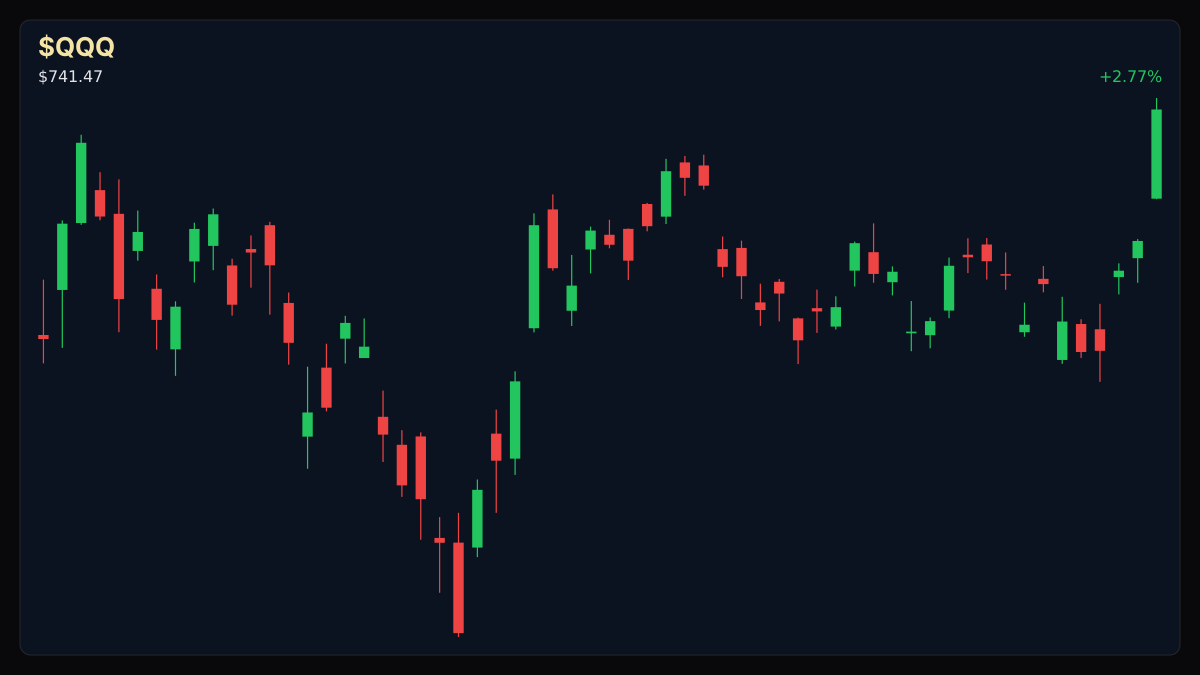
Educational TradingView chart — search any symbol in the widget. Confirm on /markets/QQQ. Not investment advice.
Related markets
Shares a vertical MP4 loop to your phone's camera roll or app share sheet (Instagram, TikTok, Facebook Reels).
Evaluating the Invesco $QQQ+WL Trust ($QQQ+WL) and its underlying Nasdaq-100 index provides a historical window into technology sector performance since September 2006. Over the past decade, the tech-heavy vehicle has delivered average annual returns of approximately 20.8%, outperforming the S&P 500 index (^GSPC) during extended stretches. However, forward-looking forecasts introduce comparative value considerations against broader asset classes.
### Session Tape - **$QQQ+WL:** +2.88% - **^GSPC:** +1.49%
## Catalyst Analysis: Historical Compounding vs. Prospective Horizons Long-term projections depend heavily on compound annual growth assumptions. Historical data indicates that a $10,000 principal growing at a 20.8% annualized rate reaches $25,724 after five years, $66,171 after 10 years, and $437,863 over a 20-year horizon. Conversely, if long-term annualized returns moderate to a 10.8% rate observed over broader 27-year intervals, a 20-year allocation scales to $77,767. Recent research from Vanguard suggests potential headwinds for domestic growth equities relative to value and international categories over multi-decade cycles, prompting market participants to re-examine baseline portfolio expectations.
## Impact on Broad Market Allocations Portfolio construction strategies weigh index concentration risks against historical outperformance. While low-cost vehicles tracking large-cap technology have served as primary engines for capital appreciation, balanced asset allocation frameworks account for cyclical sector rotations and shifting macro regimes.
Read the full story
Original reporting and related coverage — attribution links only, not paid recommendations.
Trade this story
 Robinhood
 Webull
 Tradier
 IBKR
IBKR
Chart this story
 TradingView
Broker and exchange buttons use invite / refer-a-friend links (rewards may be capped). Charting links (TradingView) are partner offers that may pay OppHub America a commission at no extra cost to you.
OppSHOP
Full OppSHOP →As an Amazon Associate, OppHub America earns from qualifying purchases. Shopping here helps keep the site free — at no extra cost to you. Disclosure

OppSHOP
Related to this story
Long-term equity indexing strategies remain sensitive to secular growth
Shop related →

Investing books
Read the classics
Shop this pick →

Personal finance books
Run the household books
Shop this pick →

Trading notebooks
Write the thesis first
Shop this pick →

Monitor for charts
See every pane
Shop this pick →
Story playbook
A pre-built map of what to watch — stocks, ETFs, and educational next steps. Not personalized advice.
Snapshot date: September 22, 2026 at 7:36 AM ET
This playbook was built when the story published and is not live-updated. Prices, news, and risk can change after this date — treat it as a starting map, not a current trade ticket.
Story → money map
growth index compounding
Tech stocks have grown very fast over the past ten years, making many investors rich. However, experts warn that future growth might slow down, so people are looking at other types of investments to keep their money safe.
What changed
Historical performance data for the Nasdaq-100 prompted renewed debate over future growth moderation and portfolio diversification.
Who wins / who loses
Tech index fund holders win from past compounding, while diversified or value-oriented investors may outperform if growth slows.
Time horizon
Think in terms of the next few months.
Confidence & best fit
medium confidence · Long-term investor, Side income / builder
Safer theme exposure (ETFs)
Baskets that own the theme without betting on one company.
Single stocks (higher risk)
Primary = closest to the story · Peers = same industry · Second-order = knock-on effects · Avoid = looks related but may be a trap
Primary
- $QQQWatch — track, don’t rush
This is the main fund tracking the big tech stocks mentioned in the article.
View $QQQ chart → · End-of-day delayed data
Peer
- $SPYBuild slowly — only if it fits your plan
A broader market fund that spreads your money across more industries instead of just tech.
View $SPY chart → · End-of-day delayed data
Options (education only)
No strikes or expiries — a framework for how traders might express the view. Options can expire worthless.
Direction: volatile · Style: Covered-call income (only if you already own shares) · Level: beginner
Beginners should skip options here and stick to basic investing, as this strategy is just for generating extra cash on stocks you already own.
Income / OppHub America angle
Not a trade tip — ways to use the insight outside the market.
- Rebalancing retirement accounts to ensure proper asset allocation across growth and value categories.
What would break this thesis
- Continued acceleration of artificial intelligence productivity gains driving sustained high tech earnings growth.
What to do next on OppHub America
Saved playbooks stay on this device for now.
Important
Not financial advice. OppHub America playbooks are educational market maps only — not recommendations to buy, sell, or hold any security. Markets move fast; information can be wrong or outdated. Trade and invest at your own risk. Do your own research or consult a licensed advisor.
Based on reporting from yahoo-tickers-tape-movers.
Informational and educational only — not investment, financial, or legal advice. Disclosure
Shares a vertical MP4 loop to your phone's camera roll or app share sheet (Instagram, TikTok, Facebook Reels).