OppHub America Desk · · Source: yahoo-tickers-tape-movers
Nasdaq Nears Correction as Tech Sell-Off Deepens on AI Skepticism
Monitor sector-wide sentiment and valuation multiples across major index components as the Nasdaq tests correction levels.
Based on reporting from yahoo-tickers-tape-movers.
Following another sell-off in technology equities, the Nasdaq Composite trades near correction territory, down roughly 8% from its peak as investors rotate away from high-capex artificial intelligence trades. The pullback comes amid broader hyperscaler spending scrutiny highlighted by recent corporate updates.
Market context for this story
As of: Regular HoursLoading quotes…
Informational only — not investment advice. Full markets →

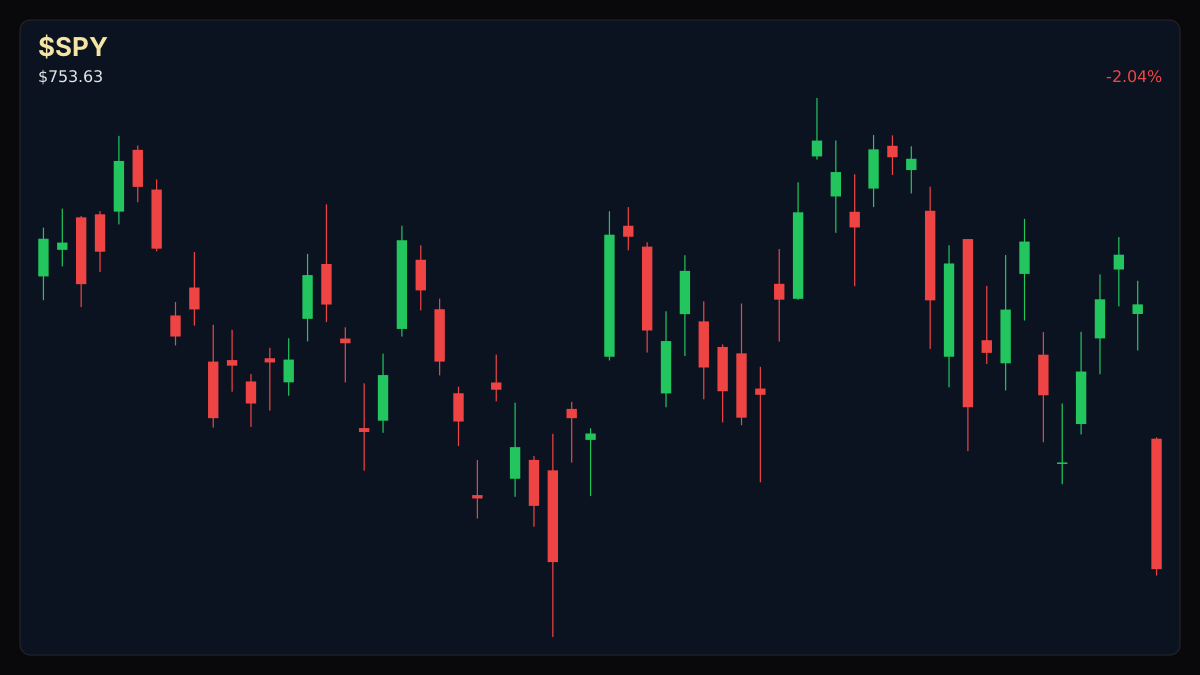
$SPYSPDR S&P 500 ETF
TradingView
Live chart & market data via TradingView · OppHub classroom · Delayed or exchange real-time per TradingView data agreements · Not investment advice
Educational TradingView chart — search any symbol in the widget. Confirm on /markets/SPY. Not investment advice.
Related markets
Shares a vertical MP4 loop to your phone's camera roll or app share sheet (Instagram, TikTok, Facebook Reels).
## Session Tape — Friday, October 30, 2026 As of Friday, October 30, 2026, major equity benchmarks and indexes faced downward pressure: - **Nasdaq Composite (^IXIC):** down 3.19% to 25,362.92 - **S&P 500:** down 1.9% to 7,570.87 - **Dow Jones Industrial Average:** down 1.0% to 51,830.51 - **Bitcoin:** down 4.5% to $77,188.00
## Catalyst Analysis: AI Spending Scrutiny and Index Correction The Nasdaq Composite is testing correction thresholds, down approximately 8% from recent closing peaks following persistent selling pressure across technology heavyweights. Market participants have grown increasingly cautious regarding the unprecedented infrastructure buildout funded by major cloud providers. Combined operating income across core platforms reached roughly $490 billion over the past year against a backdrop of aggressive capital expenditures projected to surpass $700 billion annually, triggering valuation compression as free cash flow metrics draw closer inspection.
## Impact on Tech Sector Valuations Cumulative market capitalization for leading platform operators stands at $11.5 trillion, trading at an aggregate multiple of 23.5 times operating income. Individual equity movements on the session reflected broad risk-off positioning across cloud and semiconductor groups, with market participants reassessing return on invested capital for artificial intelligence infrastructure.
### Money Play Market participants navigating ongoing tech sector volatility should maintain strict risk management as the Nasdaq approaches technical correction territory.
Read the full story
Original reporting and related coverage — attribution links only, not paid recommendations.
Trade this story
 Robinhood
 Webull
 Tradier
 IBKR
Chart this story
 TradingView
Broker and exchange buttons use invite / refer-a-friend links (rewards may be capped). Charting links (TradingView) are partner offers that may pay OppHub America a commission at no extra cost to you.
OppSHOP
Full OppSHOP →As an Amazon Associate, OppHub America earns from qualifying purchases. Shopping here helps keep the site free — at no extra cost to you. Disclosure

OppSHOP
Related to this story
Monitor sector-wide sentiment and valuation multiples across major index
Shop related →

Investing books
Read the classics
Shop this pick →

Personal finance books
Run the household books
Shop this pick →

Trading notebooks
Write the thesis first
Shop this pick →

Monitor for charts
See every pane
Shop this pick →
Based on reporting from yahoo-tickers-tape-movers.
Informational and educational only — not investment, financial, or legal advice. Disclosure
Shares a vertical MP4 loop to your phone's camera roll or app share sheet (Instagram, TikTok, Facebook Reels).