Barry, OppHub America Desk · · Source: yahoo-tickers-tape-movers
Netflix Cash Flow vs Earnings: NFLX Free Cash Flow Analysis
Based on reporting from yahoo-tickers-tape-movers.
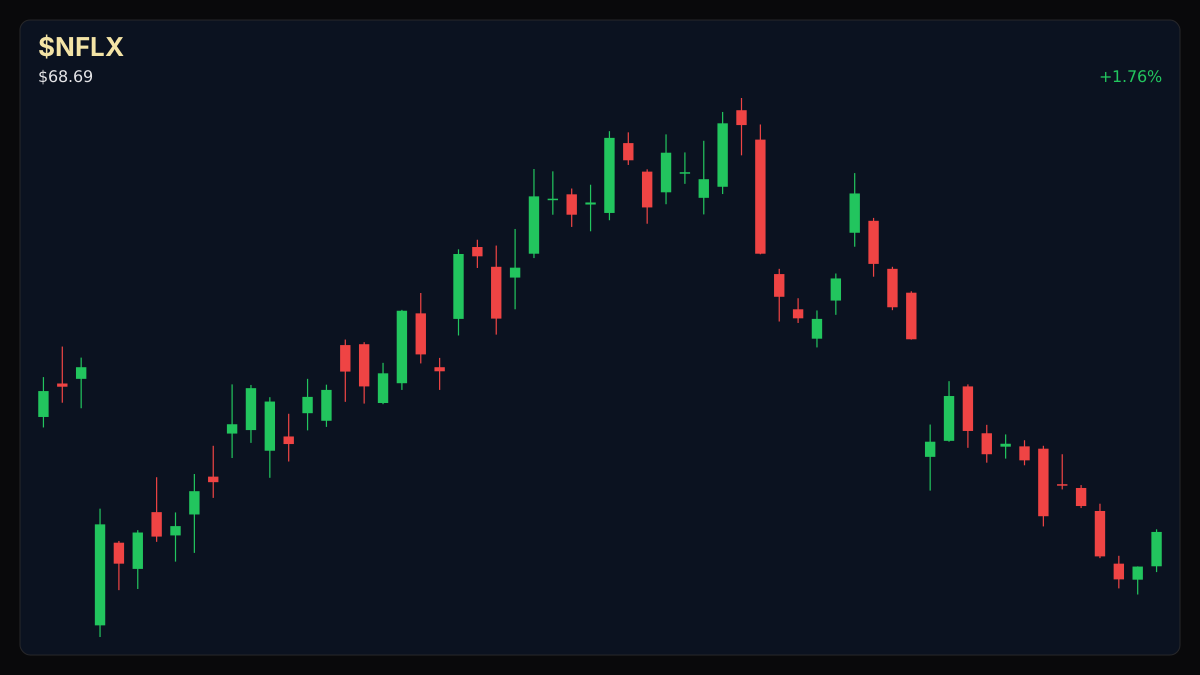
Netflix, Inc. (NASDAQ: NFLX) trades near its 52-week low of $65.08, hovering around $67 as investors weigh twelve-month net income of $13.65 billion against $11.15 billion in free cash flow. Operating margins hit 33.38% alongside 13.40% revenue growth, offering a key window into cash conversion dynamics for market participants.
Market context for this story
As of: After HoursLoading quotes…
Informational only — not investment advice. Full markets →


$NFLX
TradingView
Live chart & market data via TradingView · OppHub classroom · Delayed or exchange real-time per TradingView data agreements · Not investment advice
Educational TradingView chart — search any symbol in the widget. Confirm on /markets/NFLX and related $AMZN, $EBAY. Not investment advice.
Related markets
Shares a vertical MP4 loop to your phone's camera roll or app share sheet (Instagram, TikTok, Facebook Reels).
Netflix, Inc. (NASDAQ: NFLX) trades near its 52-week low of $65.08, sitting at approximately $67 as market participants dissect the relationship between reported profit and cash generation. Operating margin stands at 33.38% with a return on equity of 49.54% on revenue growth of 13.40% and earnings growth of 8.80%.
### Tape & Cash Metrics
The streaming giant recorded net income of $13.65 billion over the preceding twelve months, while free cash flow reached $11.15 billion. Debt stands at $16.65 billion against $9.13 billion in cash reserves, operating alongside a dividend policy that distributes no payout.
### Story Arc / How We Got Here This cash flow review follows prior coverage on September 29, 2026, when Deutsche Bank shifted NFLX to Buy citing underappreciated international engagement. That prior analysis can be reviewed in the archive at /explore/netflix-stock-upgraded-deutsche-bank-shifts-nflx-to-buy.
### Money Play If cash flow conversion lags reported earnings expansion, watch $NFLX+WL and related tech names such as , $AMZN+WL, and $EBAY+WL for broader valuation reassessments.
### Why This Lane Matters Discrepancies between accounting net income and actual free cash flow highlight capital intensity and balance sheet resilience across major digital platforms, directly impacting sector multiples.
Read the full story
Original reporting and related coverage — attribution links only, not paid recommendations.
Trade this story
 Robinhood
 Webull
 Tradier
 IBKR
IBKR
Chart this story
 TradingView
Broker and exchange buttons use invite / refer-a-friend links (rewards may be capped). Charting links (TradingView) are partner offers that may pay OppHub America a commission at no extra cost to you.
OppSHOP
Full OppSHOP →As an Amazon Associate, OppHub America earns from qualifying purchases. Shopping here helps keep the site free — at no extra cost to you. Disclosure





Story playbook
A pre-built map of what to watch — stocks, ETFs, and educational next steps. Not personalized advice.
Snapshot date: October 6, 2026 at 8:56 PM ET
This playbook was built when the story published and is not live-updated. Prices, news, and risk can change after this date — treat it as a starting map, not a current trade ticket.
Story → money map
streaming cash conversion
Netflix is trading near its lowest price in a year while investors compare its reported profits to actual cash coming in the door. People who invest money care about this because a company's ability to turn profits into hard cash shows how strong its business really is.
What changed
Market participants are re-evaluating Netflix shares near lows as they scrutinize the gap between reported net income and free cash flow generation.
Who wins / who loses
Platform giants with strong cash conversion win relative trust, while digital platforms facing capital intensity risks may see valuation multiples compressed.
Time horizon
Think in terms of the next few months.
Confidence & best fit
medium confidence · Long-term investor, Active trader
Safer theme exposure (ETFs)
Baskets that own the theme without betting on one company.
Single stocks (higher risk)
Primary = closest to the story · Peers = same industry · Second-order = knock-on effects · Avoid = looks related but may be a trap
Primary
- $NFLXWatch — track, don’t rush
We are keeping an eye on Netflix to see if it can turn its accounting profits into real cash.
View $NFLX chart → · End-of-day delayed data
Peer
- $AAPLWatch — track, don’t rush
Apple is a fellow tech giant that investors often compare when looking at tech stock values.
View $AAPL chart → · End-of-day delayed data
- $AMZNWatch — track, don’t rush
Amazon is another massive tech platform affected by how the market values big tech profits.
View $AMZN chart → · End-of-day delayed data
Second-order
- $EBAYWatch — track, don’t rush
EBay moves along with general shifts in how investors view digital commerce companies.
View $EBAY chart → · End-of-day delayed data
Options (education only)
No strikes or expiries — a framework for how traders might express the view. Options can expire worthless.
Beginners should skip options here and stick to watching how the stock behaves at these price levels.
See options-friendly brokers →Income / OppHub America angle
Not a trade tip — ways to use the insight outside the market.
- Reviewing subscription media consumption trends and international engagement metrics.
What would break this thesis
- Free cash flow accelerating past net income or sustained multiple expansion across the tech sector.
What to do next on OppHub America
Saved playbooks stay on this device for now.
Important
Not financial advice. OppHub America playbooks are educational market maps only — not recommendations to buy, sell, or hold any security. Markets move fast; information can be wrong or outdated. Trade and invest at your own risk. Do your own research or consult a licensed advisor.
Aftermath · $NVDA
+0.14% vs write
- •Since this piece: $NVDA is flat +0.14% vs $238.90 at write time (now $239.24).
- •Session move (Yahoo delayed): +0.14%.
- •RSI14 at write was 84.6 — compare levels on Markets, not advice.
- •Original money play lens: If cash conversion lags net income, watch and related tech vehicles like $AAPL and for valuation shifts.
- •Track $NVDA live on OppHub Markets (/markets/NVDA). Not financial advice.
Based on reporting from yahoo-tickers-tape-movers.
Informational and educational only — not investment, financial, or legal advice. Disclosure
Shares a vertical MP4 loop to your phone's camera roll or app share sheet (Instagram, TikTok, Facebook Reels).