Barry, OppHub America Desk · · Source: yahoo-tickers-tape-movers
Netflix Shares Fall as Reports Indicate Viewers Watch Less
If viewing engagement metrics soften further, watch because lower watch time can pressure subscriber monetization and test recent valuation floors.
Based on reporting from yahoo-tickers-tape-movers.
Netflix shares slipped as recent reports indicate lower viewer engagement, putting pressure on valuation metrics. Investors tracking the streaming giant note that the equity has lost nearly 32% this year and trades well below its 52-week high of $116.73 as of Tuesday, October 27, 2026.
Market context for this story
As of: After HoursLoading quotes…
Informational only — not investment advice. Full markets →


$XLYConsumer Discretionary
TradingView
Live chart & market data via TradingView · OppHub classroom · Delayed or exchange real-time per TradingView data agreements · Not investment advice
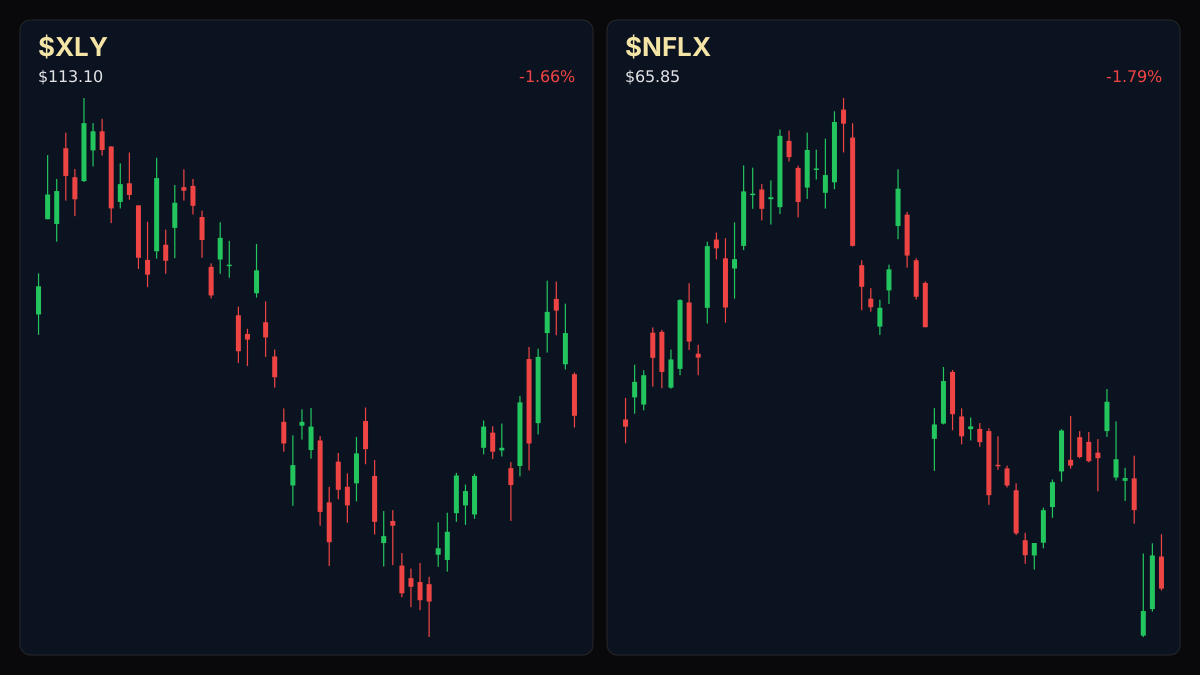
Educational TradingView chart — search any symbol in the widget. Confirm on /markets/XLY and related $NFLX. Not investment advice.
Related markets
Shares a vertical MP4 loop to your phone's camera roll or app share sheet (Instagram, TikTok, Facebook Reels).
Netflix shares dropped following reports that subscribers are spending less time watching content, prompting renewed concern across Wall Street regarding user engagement metrics.
### Money Play If viewing engagement metrics soften further, watch $NFLX+WL because lower watch time can pressure subscriber monetization and test recent valuation floors.
### Tape / Session Read As of Tuesday, October 27, 2026, Netflix (NASDAQ: NFLX) shares have lost nearly 32% this year and are trading about 45% below their 52-week high of $116.73, according to reports from Barrons.com.
### Story Arc / How We Got Here This pullback extends ongoing volatility for the streaming leader. As explored previously in Netflix Stock Fourth-Quarter History: Assessing Seasonality and Valuation on October 18, 2026, historical fourth-quarter performance has shown gains in 17 of the last 24 years, yet recent quarterly results have diverged sharply from historical medians, forcing traders to weigh seasonal tendencies against fundamental engagement data.
### Why This Lane Matters Engagement trends dictate long-term pricing power and ad-tier monetization for major streaming platforms, directly shaping risk appetite within consumer discretionary and communication services sectors.
## $NFLX+WL Technical Analysis & Key Risk Watch — Tape and Valuation Levels
Trading near depressed levels relative to its 52-week peak of $116.73, $NFLX+WL requires close observation of support zones as market participants reassess subscriber retention and viewing velocity.
### Story Arc / How We Got Here
This follows our earlier coverage ([Netflix Stock Fourth-Quarter History: Assessing Seasonality and Valuation](/explore/netflix-stock-fourth-quarter-history-assessing-seasonality-and-valuation)) on 2026-10-18. Netflix historical fourth-quarter performance shows gains in 17 of the last 24 years, though recent quarterly results have diverged sharply from historical medians. Traders assessing fourth-quarter positioning look closely at historical seasonal tendencies against current valuation metrics. · Historical fourth-quarter seasonality offers structural context for tape behavior, but investment decisions require alignment with verified earnings execution rather than calendar patterns alone.
Read the full story
Original reporting and related coverage — attribution links only, not paid recommendations.
Trade this story
 Robinhood
 Webull
 Tradier
 IBKR
Chart this story
 TradingView
Broker and exchange buttons use invite / refer-a-friend links (rewards may be capped). Charting links (TradingView) are partner offers that may pay OppHub America a commission at no extra cost to you.
OppSHOP
Full OppSHOP →As an Amazon Associate, OppHub America earns from qualifying purchases. Shopping here helps keep the site free — at no extra cost to you. Disclosure

OppSHOP
Related to this story
If viewing engagement metrics soften further, watch because lower watch
Shop related →

Investing books
Read the classics
Shop this pick →

Personal finance books
Run the household books
Shop this pick →

Trading notebooks
Write the thesis first
Shop this pick →

Monitor for charts
See every pane
Shop this pick →
Story playbook
A pre-built map of what to watch — stocks, ETFs, and educational next steps. Not personalized advice.
Snapshot date: October 26, 2026 at 9:07 PM ET
This playbook was built when the story published and is not live-updated. Prices, news, and risk can change after this date — treat it as a starting map, not a current trade ticket.
Story → money map
streaming engagement
Netflix stock dropped because reports show people are spending less time watching its shows and movies. Wall Street watches this closely because less viewing time can make it harder to sell ads and keep subscribers happy.
What changed
Reports of lower viewer engagement sparked fresh concerns over subscriber monetization and valuation.
Who wins / who loses
Competitors with stronger engagement or diversified media streams benefit, while streaming-reliant platforms like Netflix face valuation pressure.
Time horizon
Think in terms of the next few weeks.
Confidence & best fit
medium confidence · Active trader
Safer theme exposure (ETFs)
Baskets that own the theme without betting on one company.
Single stocks (higher risk)
Primary = closest to the story · Peers = same industry · Second-order = knock-on effects · Avoid = looks related but may be a trap
Primary
- $NFLXWatch — track, don’t rush
If people watch less, the company makes less money, which can push the stock price lower.
View $NFLX chart → · End-of-day delayed data
Peer
- $DISWatch — track, don’t rush
Other big entertainment companies face the same risk of people watching less.
View $DIS chart → · End-of-day delayed data
Second-order
- $ROKUWatch — track, don’t rush
Device and channel makers could see less ad traffic if overall viewing slows down.
View $ROKU chart → · End-of-day delayed data
Options (education only)
No strikes or expiries — a framework for how traders might express the view. Options can expire worthless.
Direction: volatile · Style: Protective put / downside hedge idea · Level: intermediate
Beginners should skip options here, as predicting short-term stock drops during volatile engagement news is tricky.
Income / OppHub America angle
Not a trade tip — ways to use the insight outside the market.
- Monitor upcoming quarterly streaming metrics and ad-tier adoption rates.
What would break this thesis
- Engagement metrics rebound strongly in the next earnings report, proving the slowdown was temporary.
What to do next on OppHub America
Saved playbooks stay on this device for now.
Important
Not financial advice. OppHub America playbooks are educational market maps only — not recommendations to buy, sell, or hold any security. Markets move fast; information can be wrong or outdated. Trade and invest at your own risk. Do your own research or consult a licensed advisor.
Based on reporting from yahoo-tickers-tape-movers.
Informational and educational only — not investment, financial, or legal advice. Disclosure
Shares a vertical MP4 loop to your phone's camera roll or app share sheet (Instagram, TikTok, Facebook Reels).