Barry, OppHub America Desk · · Source: yahoo-tickers-tape-movers
Netflix Stock Pulls Back: Revenue Rises as Guidance Weighs
Housing & mortgages: Rate and housing policy spill into builders, small-caps, and REITs.
Based on reporting from yahoo-tickers-tape-movers.
Netflix shares face pressure despite reporting a 13% increase in second-quarter revenue to more than $12.6 billion, as competitive headwinds and softer third-quarter guidance weigh on investor sentiment. The streaming giant's near-term outlook has left market participants cautious amid intensifying competition from major digital platforms.
Market context for this story
As of: After HoursLoading quotes…
Informational only — not investment advice. Full markets →


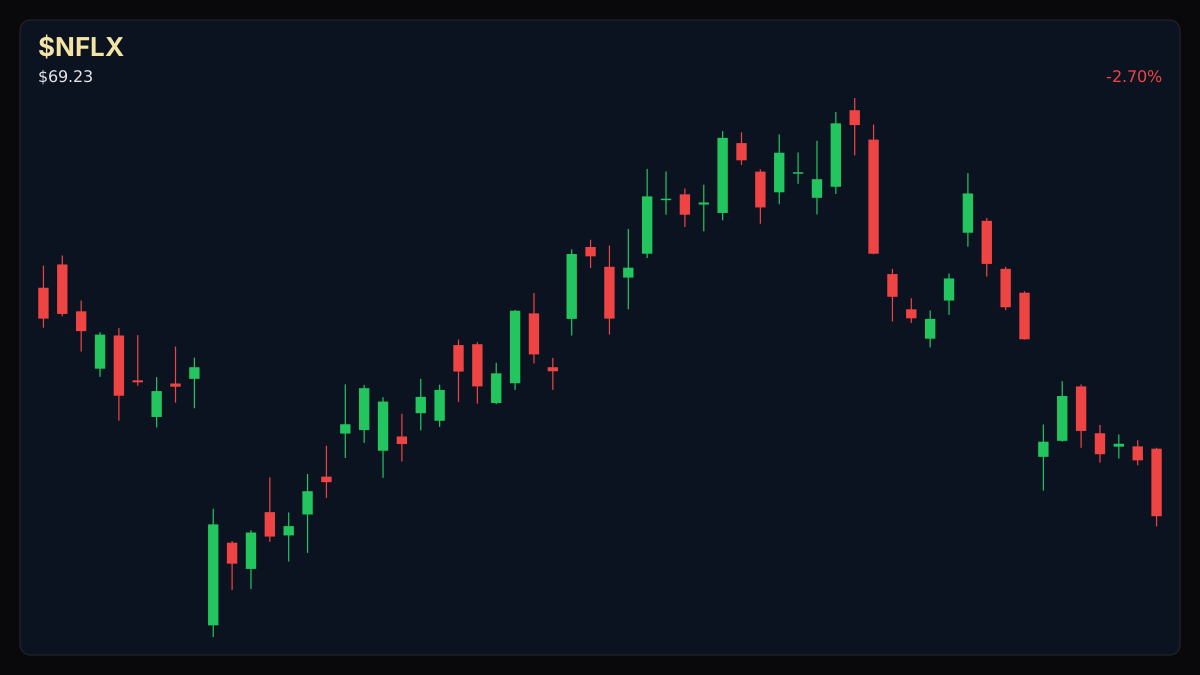
$NFLX
TradingView
Live chart & market data via TradingView · OppHub classroom · Delayed or exchange real-time per TradingView data agreements · Not investment advice
Educational TradingView chart — search any symbol in the widget. Confirm on /markets/NFLX and related $GOOGL. Not investment advice.
Related markets
Shares a vertical MP4 loop to your phone's camera roll or app share sheet (Instagram, TikTok, Facebook Reels).
### Session Tape — Netflix (NFLX -2.69%)
## Catalyst Analysis: Guidance and Competition Netflix (NFLX) continues to navigate a challenging market environment, with the equity declining more than 40% over the past 12 months. While second-quarter revenue expanded 13% year-over-year to surpass $12.6 billion, operating margins and free cash flow experienced compression. Part of this cash flow pressure stemmed from tax liabilities tied to a $2.8 billion payment received from Warner Bros. Discovery following a terminated acquisition.
Beyond financial metrics, market participants point to intensifying competition within the streaming sector, notably from Alphabet's YouTube, which continues to capture significant viewer attention and market share. Furthermore, third-quarter revenue projections anticipated by management came in below Wall Street expectations, with projected revenue tracking closer to $12.86 billion compared to consensus estimates of $13 billion.
## $NFLX+WL Technical Analysis & Key Risk Watch
The equity trades near its 52-week lows, reflecting sustained downside momentum and broader profit-taking consolidation across growth segments. Traders tracking the security monitor support thresholds near recent cyclical floors, while overhead resistance remains intact as sellers maintain near-term control.
### Money Play
Read the full story
Original reporting and related coverage — attribution links only, not paid recommendations.
Trade this story
 Robinhood
 Webull
 Tradier
 IBKR
IBKR
Chart this story
 TradingView
Broker and exchange buttons use invite / refer-a-friend links (rewards may be capped). Charting links (TradingView) are partner offers that may pay OppHub America a commission at no extra cost to you.
OppSHOP
Full OppSHOP →As an Amazon Associate, OppHub America earns from qualifying purchases. Shopping here helps keep the site free — at no extra cost to you. Disclosure

OppSHOP
Related to this story
Housing & mortgages: Rate and housing policy spill into builders, small-
Shop related →

Investing books
Read the classics
Shop this pick →

Personal finance books
Run the household books
Shop this pick →

Trading notebooks
Write the thesis first
Shop this pick →

Monitor for charts
See every pane
Shop this pick →
Story playbook
A pre-built map of what to watch — stocks, ETFs, and educational next steps. Not personalized advice.
Snapshot date: September 28, 2026 at 6:26 PM ET
This playbook was built when the story published and is not live-updated. Prices, news, and risk can change after this date — treat it as a starting map, not a current trade ticket.
Story → money map
streaming competition and growth guidance
Netflix made more money than last year, but their future predictions disappointed Wall Street because other streaming companies are fighting hard for viewers. Investors are being extra careful with entertainment stocks right now.
What changed
Netflix reported higher quarterly revenue but issued weaker-than-expected third-quarter guidance amid rising competition.
Who wins / who loses
Alternative digital platforms like YouTube benefit from capturing viewer attention, while traditional streaming services with slowing guidance are penalized.
Time horizon
Think in terms of the next few weeks.
Confidence & best fit
medium confidence · Active trader
Safer theme exposure (ETFs)
Baskets that own the theme without betting on one company.
Single stocks (higher risk)
Primary = closest to the story · Peers = same industry · Second-order = knock-on effects · Avoid = looks related but may be a trap
Primary
- $NFLXWatch — track, don’t rush
The main stock in the news is dropping in price, so we need to wait and see if it stops falling.
View $NFLX chart → · End-of-day delayed data
Peer
- $GOOGLBuild slowly — only if it fits your plan
Google owns YouTube, which is successfully taking viewers and ad money away from traditional streaming apps.
View $GOOGL chart → · End-of-day delayed data
Second-order
- $WBDWatch — track, don’t rush
Another big media company dealing with similar financial pressures and shifting industry trends.
View $WBD chart → · End-of-day delayed data
Options (education only)
No strikes or expiries — a framework for how traders might express the view. Options can expire worthless.
Direction: bearish · Style: Protective put / downside hedge idea · Level: intermediate
Think of this like buying insurance for your stock in case the price drops further; beginners should probably skip options and stick to regular shares or ETFs.
Income / OppHub America angle
Not a trade tip — ways to use the insight outside the market.
- Review household subscription budgets to cut unused streaming services.
What would break this thesis
- Substantially higher-than-expected subscriber additions in subsequent quarters.
- Broader tech sector rally breaking overhead technical resistance.
What to do next on OppHub America
Saved playbooks stay on this device for now.
Important
Not financial advice. OppHub America playbooks are educational market maps only — not recommendations to buy, sell, or hold any security. Markets move fast; information can be wrong or outdated. Trade and invest at your own risk. Do your own research or consult a licensed advisor.
Aftermath · $NVDA
+0.65% vs write
- •Since this piece: $NVDA is up +0.65% vs $227.38 at write time (now $228.86).
- •Session move (Yahoo delayed): +1.68%.
- •RSI14 at write was 56.3 — compare levels on Markets, not advice.
- •Original money play lens: Housing & mortgages: Rate and housing policy spill into builders, small-caps, and REITs.
- •Track $NVDA live on OppHub Markets (/markets/NVDA). Not financial advice.
Based on reporting from yahoo-tickers-tape-movers.
Informational and educational only — not investment, financial, or legal advice. Disclosure
Shares a vertical MP4 loop to your phone's camera roll or app share sheet (Instagram, TikTok, Facebook Reels).