Barry, OppHub America Desk · · Source: yahoo-tickers-tape-movers
Netflix Stock Valuation Ahead of Third-Quarter Earnings on Oct. 20
Investors tracking streaming sentiment and upcoming reporting calendars should monitor volatility parameters around key resistance levels without relying on directional momentum.
Based on reporting from yahoo-tickers-tape-movers.
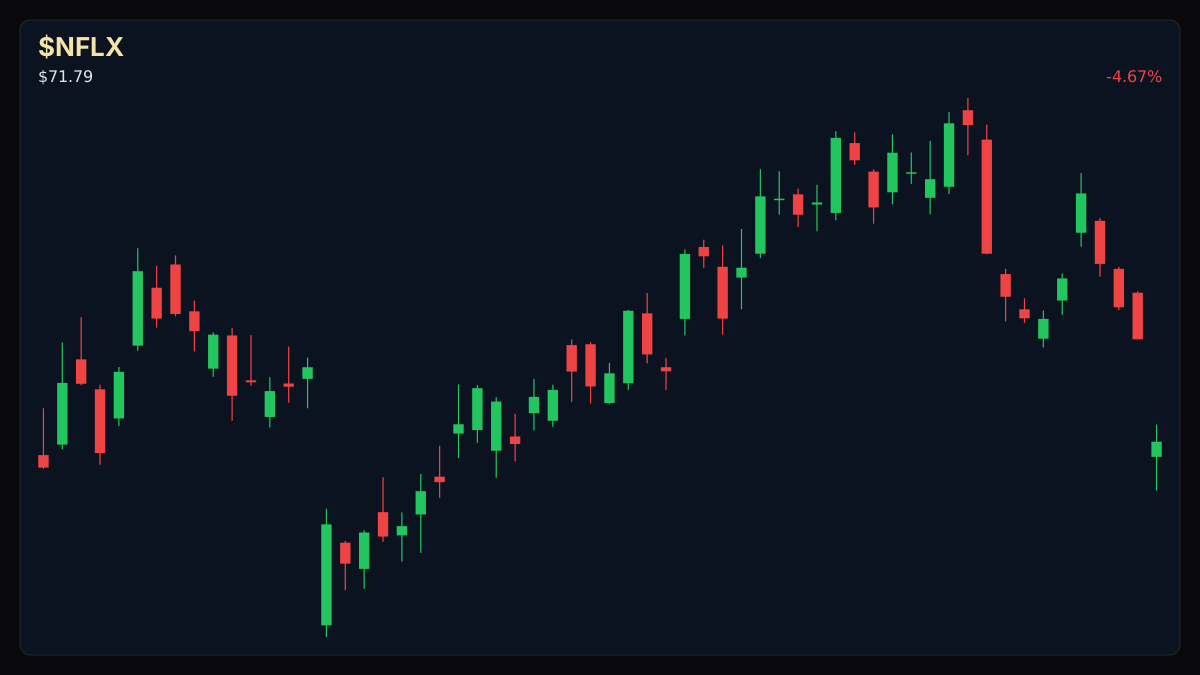
Netflix shares face downward pressure, dropping 4.67% and down 23% from prior highs, as investors weigh growth sentiment ahead of the company's scheduled third-quarter earnings report on Tuesday, October 20, 2026. With historical earnings reactions showing consecutive post-report pullbacks, market participants are scrutinizing valuation metrics and recent leadership changes.
Market context for this story
As of: PremarketLoading quotes…
Informational only — not investment advice. Full markets →
 $NFLX
$NFLX$NFLX
TradingView
Live chart & market data via TradingView · OppHub classroom · Delayed or exchange real-time per TradingView data agreements · Not investment advice
Educational TradingView chart — search any symbol in the widget. Confirm on /markets/NFLX. Not investment advice.
Related markets
Shares a vertical MP4 loop to your phone's camera roll or app share sheet (Instagram, TikTok, Facebook Reels).
### Session Tape - **NFLX:** -4.67% ($71.79)
## Catalyst Analysis: Pre-Earnings Positioning Netflix trades down 4.67% at $71.79, bringing its year-to-date pullback to 23% as investors navigate a bearish sentiment backdrop. The streaming giant has experienced leadership transitions with co-founder Reed Hastings departing and continued market discussion surrounding acquisition speculation. Trading within a daily range of $70.11 to $72.38 and an extensive 52-week band spanning $65.08 to $124.86, the equity reflects compression toward its lower valuation bounds. With a gross margin of 49.53% and a trailing valuation under 23 times earnings, market participants are focusing on whether upcoming third-quarter metrics on Tuesday, October 20, 2026, can spark a reversal from its historical post-earnings weakness.
## $NFLX+WL Technical Analysis & Key Risk Watch
With the Relative Strength Index (RSI-14) situated at 53.7, the equity sits near neutral momentum thresholds ahead of the October reporting date. The 52-week floor near $65.08 serves as immediate downside support, while resistance aligns closer to the $72.38 session ceiling. Traders tracking the pre-earnings tape should observe volume participation, as historical reports over the last five quarters have triggered immediate downward revisions despite varying fundamental prints.
## Impact on Broad Streaming & Media Broader entertainment and streaming vehicles face spillover sentiment as market participants gauge consumer discretionary allocation toward subscription services. Valuation contraction in premier streaming equities influences sentiment across consumer goods and media assets, keeping overall sector multiples under close review.
Read the full story
Original reporting and related coverage — attribution links only, not paid recommendations.
Trade this story
 Robinhood
 Webull
 Tradier
 IBKR
IBKR
Chart this story
 TradingView
Broker and exchange buttons use invite / refer-a-friend links (rewards may be capped). Charting links (TradingView) are partner offers that may pay OppHub America a commission at no extra cost to you.
OppSHOP
Full OppSHOP →As an Amazon Associate, OppHub America earns from qualifying purchases. Shopping here helps keep the site free — at no extra cost to you. Disclosure

OppSHOP
Related to this story
Investors tracking streaming sentiment and upcoming reporting calendars
Shop related →

Investing books
Read the classics
Shop this pick →

Personal finance books
Run the household books
Shop this pick →

Trading notebooks
Write the thesis first
Shop this pick →

Monitor for charts
See every pane
Shop this pick →
Story playbook
A pre-built map of what to watch — stocks, ETFs, and educational next steps. Not personalized advice.
Snapshot date: September 21, 2026 at 8:27 AM ET
This playbook was built when the story published and is not live-updated. Prices, news, and risk can change after this date — treat it as a starting map, not a current trade ticket.
Story → money map
streaming earnings volatility
Netflix stock dropped recently because investors are nervous about its upcoming earnings report and recent changes in company leadership. Money managers are watching closely to see if the company can bounce back from its recent downward trend.
What changed
Netflix shares dropped 4.67% to $71.79, bringing its total pullback to 23% ahead of the third-quarter earnings release on October 20, 2026.
Who wins / who loses
Short-term options traders and volatility hedgers benefit from heightened pre-earnings movement, while long-only equity holders face immediate valuation compression.
Time horizon
Think in terms of the next few weeks.
Confidence & best fit
medium confidence · Active trader
Safer theme exposure (ETFs)
Baskets that own the theme without betting on one company.
Single stocks (higher risk)
Primary = closest to the story · Peers = same industry · Second-order = knock-on effects · Avoid = looks related but may be a trap
Primary
- $NFLXWatch — track, don’t rush
This is the main company in the news, and investors are waiting to see if its earnings report will cause the stock price to jump or drop further.
View $NFLX chart → · End-of-day delayed data
Peer
- $DISWatch — track, don’t rush
Another major entertainment company that streams movies and shows, which often moves in the same direction as Netflix.
View $DIS chart → · End-of-day delayed data
Options (education only)
No strikes or expiries — a framework for how traders might express the view. Options can expire worthless.
Direction: volatile · Style: Protective put / downside hedge idea · Level: intermediate
Because earnings reports can cause big, sudden price swings, some traders use options like insurance policies to protect against sudden drops. Beginners should generally skip options during earnings because prices can change very fast.
Income / OppHub America angle
Not a trade tip — ways to use the insight outside the market.
- Monitor consumer subscription fatigue indicators across major streaming platforms in local retail spending data.
What would break this thesis
- A decisive breakout above multi-week resistance on heavy volume accompanied by an earnings beat and raised guidance.
What to do next on OppHub America
Saved playbooks stay on this device for now.
Important
Not financial advice. OppHub America playbooks are educational market maps only — not recommendations to buy, sell, or hold any security. Markets move fast; information can be wrong or outdated. Trade and invest at your own risk. Do your own research or consult a licensed advisor.
Based on reporting from yahoo-tickers-tape-movers.
Informational and educational only — not investment, financial, or legal advice. Disclosure
Shares a vertical MP4 loop to your phone's camera roll or app share sheet (Instagram, TikTok, Facebook Reels).