Barry, OppHub America Desk · · Source: yahoo-tickers-tape-movers
Netflix Streaming Share Slips as YouTube TV Viewing Expands
Media and streaming sector valuations depend on balancing subscriber pricing power against user engagement shifts.
Based on reporting from yahoo-tickers-tape-movers.
YouTube captured a record 14.2% share of total United States television viewing in July, widening its lead over Netflix as streaming habits evolve. Market participants tracking digital media engagement must weigh platform viewership metrics against subscriber revenue growth and operating income trends.
Market context for this story
As of: WeekendLoading quotes…
Informational only — not investment advice. Full markets →
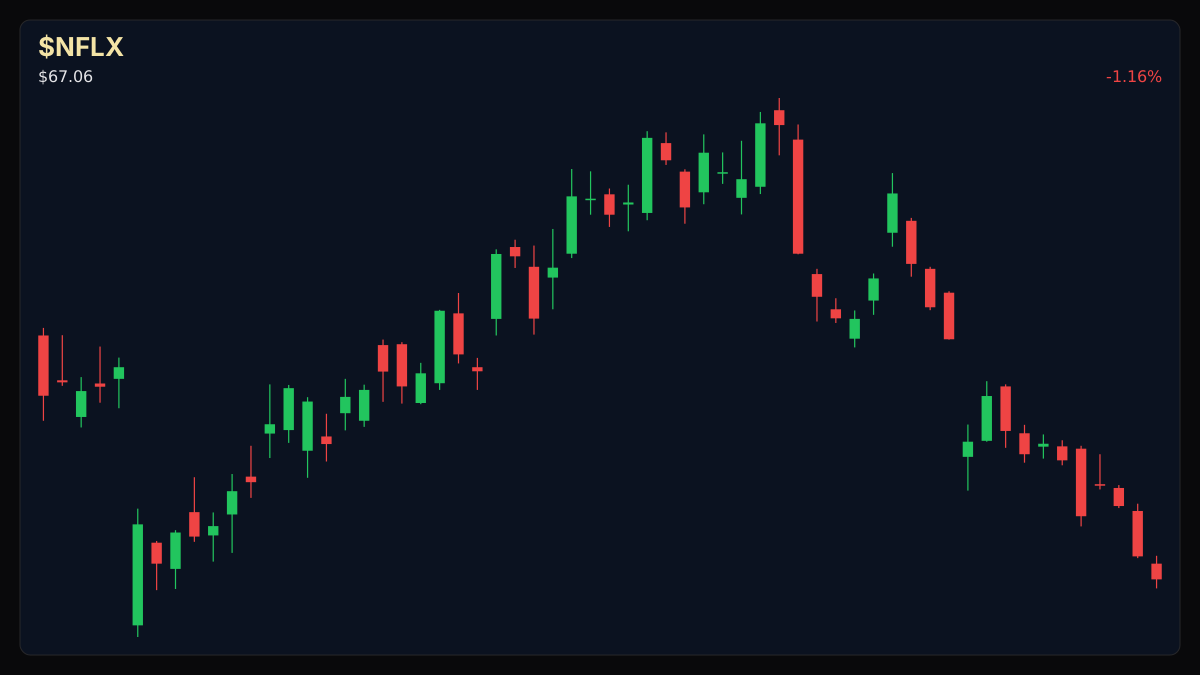
 $NFLX
$NFLX$NFLX
TradingView
Live chart & market data via TradingView · OppHub classroom · Delayed or exchange real-time per TradingView data agreements · Not investment advice
Educational TradingView chart — search any symbol in the widget. Confirm on /markets/NFLX. Not investment advice.
Related markets
Shares a vertical MP4 loop to your phone's camera roll or app share sheet (Instagram, TikTok, Facebook Reels).
### Session Tape - Nielsen Gauge data highlights shifting media consumption across major streaming platforms.
## Catalyst Analysis: Nielsen Gauge Data Shows Widening Gap
Recent Nielsen Gauge findings indicate that YouTube expanded its command of U.S. television time to 14.2% in July, up from 13.4% in July 2025. Meanwhile, Netflix captured 7.8% of viewing hours, down from 8.8% a year prior. While platform viewership metrics reflect shifting consumer habits, financial performance depends directly on subscription fees and advertising sales rather than raw hourly engagement alone.
Netflix reported second-quarter revenue of $12.6 billion, representing a 13% year-over-year increase, alongside an 11% climb in operating income to $4.2 billion. Management also implemented U.S. subscription price adjustments, lifting the standard monthly plan to $19.99 from $17.99.
Read the full story
Original reporting and related coverage — attribution links only, not paid recommendations.
Trade this story
 Robinhood
 Webull
 Tradier
 IBKR
IBKR
Chart this story
 TradingView
Broker and exchange buttons use invite / refer-a-friend links (rewards may be capped). Charting links (TradingView) are partner offers that may pay OppHub America a commission at no extra cost to you.
OppSHOP
Full OppSHOP →As an Amazon Associate, OppHub America earns from qualifying purchases. Shopping here helps keep the site free — at no extra cost to you. Disclosure

OppSHOP
Related to this story
Media and streaming sector valuations depend on balancing subscriber pri
Shop related →

Investing books
Read the classics
Shop this pick →

Personal finance books
Run the household books
Shop this pick →

Trading notebooks
Write the thesis first
Shop this pick →

Monitor for charts
See every pane
Shop this pick →
Story playbook
A pre-built map of what to watch — stocks, ETFs, and educational next steps. Not personalized advice.
Snapshot date: October 3, 2026 at 8:26 PM ET
This playbook was built when the story published and is not live-updated. Prices, news, and risk can change after this date — treat it as a starting map, not a current trade ticket.
Story → money map
streaming media viewing share
YouTube is taking up more of people's TV time compared to Netflix, according to recent media data. Investors care because more screen time usually means more advertising money, which affects company profits.
What changed
Nielsen data showed YouTube capturing a record 14.2% of U.S. TV viewing while Netflix's share slipped to 7.8%.
Who wins / who loses
Alphabet (YouTube) benefits from growing attention and ad dollars, while traditional streaming platforms face pressure to prove pricing power.
Time horizon
Think in terms of the next few months.
Confidence & best fit
medium confidence · Long-term investor, Active trader
Safer theme exposure (ETFs)
Baskets that own the theme without betting on one company.
Single stocks (higher risk)
Primary = closest to the story · Peers = same industry · Second-order = knock-on effects · Avoid = looks related but may be a trap
Primary
- $NFLXWatch — track, don’t rush
Netflix is getting less of our TV time, so it has to raise prices to keep making more money.
View $NFLX chart → · End-of-day delayed data
- $GOOGLBuild slowly — only if it fits your plan
Google owns YouTube, and since more people are watching it, businesses will likely pay more to show ads there.
View $GOOGL chart → · End-of-day delayed data
Peer
- $DISWatch — track, don’t rush
Other entertainment companies like Disney are dealing with the exact same changes in how people watch television.
View $DIS chart → · End-of-day delayed data
Second-order
- $ROKUWatch — track, don’t rush
Companies that make TV streaming devices win when people stream more overall, no matter which app they use.
View $ROKU chart → · End-of-day delayed data
Options (education only)
No strikes or expiries — a framework for how traders might express the view. Options can expire worthless.
Beginners should skip options here and stick to regular stock or ETF investing while media habits settle down.
See options-friendly brokers →Income / OppHub America angle
Not a trade tip — ways to use the insight outside the market.
- Monitor digital advertising spend trends across social and streaming platforms.
What would break this thesis
- A sudden reversal in Nielsen data showing renewed streaming hour growth for Netflix or a drop in ad revenue for YouTube.
What to do next on OppHub America
Saved playbooks stay on this device for now.
Important
Not financial advice. OppHub America playbooks are educational market maps only — not recommendations to buy, sell, or hold any security. Markets move fast; information can be wrong or outdated. Trade and invest at your own risk. Do your own research or consult a licensed advisor.
Based on reporting from yahoo-tickers-tape-movers.
Informational and educational only — not investment, financial, or legal advice. Disclosure
Shares a vertical MP4 loop to your phone's camera roll or app share sheet (Instagram, TikTok, Facebook Reels).