Barry, OppHub America Desk · · Source: yahoo-tickers-tape-movers
Nvidia $NVDA Stock Analysis: Holding Amidst High Valuation
- Investors may monitor Nvidia's (N: NVDA) sustained growth in its data center segment as a key indicator of continued market leadership in hardware.
Based on reporting from yahoo-tickers-tape-movers.
Despite a high price-to-sales ratio, an analyst remains a holder of Nvidia (NASDAQ: NVDA) stock. The company's rapid growth, particularly in data centers, and a favorable forward P/E ratio are cited as key reasons to maintain a position. This perspective comes as Nvidia continues to dominate the AI chip market.
Market context for this story
As of: WeekendLoading quotes…
Informational only — not investment advice. Full markets →

$NVDA
TradingView
Live chart & market data via TradingView · OppHub classroom · Delayed or exchange real-time per TradingView data agreements · Not investment advice
Educational TradingView chart — search any symbol in the widget. Confirm on /markets/NVDA. Not investment advice.
Related markets
Shares a vertical MP4 loop to your phone's camera roll or app share sheet (Instagram, TikTok, Facebook Reels).
Despite a high price-to-sales ratio, an analyst remains a holder of Nvidia (NASDAQ: NVDA) stock. The company's rapid growth, particularly in data centers, and a favorable forward P/E ratio are cited as key reasons to maintain a position. This perspective comes as Nvidia continues to dominate the AI chip market.
### Money Play If holding positions in semiconductor giants, investors may consider Nvidia's sustained growth trajectory despite its valuation metrics.
## Catalyst Analysis: Valuation and Growth Perspective Nvidia (NASDAQ: NVDA) reported a significant year-over-year revenue increase of 106%, with its data center segment alone experiencing a 117% surge, reaching $89 billion. This segment now constitutes approximately 93% of the company's total revenue. While the stock has averaged annual gains of 63% over the past decade, its current price-to-sales ratio stands at 17. However, the forward-looking price-to-earnings (P/E) ratio is noted at 24, which is below its five-year average of 35. The company also offers a dividend yield of 0.49% as of August 27.
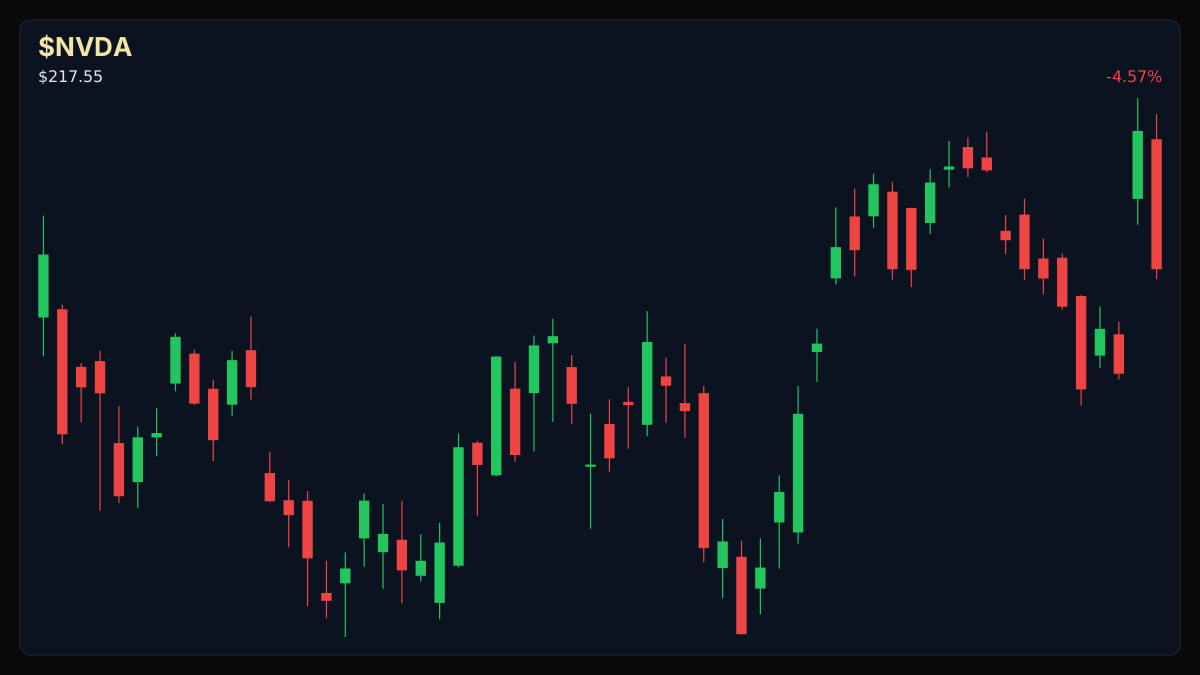
## $NVDA+WL Technical Analysis & Key Risk Watch Key levels for $NVDA+WL (educational): R2 $210.47 · R1 $208.65 · last $208.48 · S1 $208.34 · S2 $206.50.
### Sector Ripple / Impact on Semiconductors Nvidia's performance and strategy are closely watched within the semiconductor sector, influencing investor sentiment and potential portfolio allocations for related companies.
### Story Arc / How We Got Here
This follows our earlier coverage ([Nvidia $NVDA+WL Faces Portfolio Impact Amid $500B Market Shift](/explore/nvidia-nvda-faces-portfolio-impact-amid-500b-market-shift)) on 2026-08-22. Nvidia's significant market shift, dubbed a '$500 billion move' by observers, is prompting a re-evaluation of its impact on investor portfolios. The sheer scale of this valuation change suggests broader market implications beyond the chipmaker itself, potentially influencing sectors and asset allocations across the investment landscape. This dynamic warrants attention for traders and investors managing their holdings. · * If Nvidia's market valuation experiences a significant shift, investors should monitor how this impacts broader technology sector allocations and consider existing positions…
Read the full story
Original reporting and related coverage — attribution links only, not paid recommendations.
Trade this story
 Robinhood
 Webull
 Tradier
 IBKR
IBKR
Chart this story
 TradingView
Broker and exchange buttons use invite / refer-a-friend links (rewards may be capped). Charting links (TradingView) are partner offers that may pay OppHub America a commission at no extra cost to you.
OppSHOP
Full OppSHOP →As an Amazon Associate, OppHub America earns from qualifying purchases. Shopping here helps keep the site free — at no extra cost to you. Disclosure

OppSHOP
Related to this story
- Investors may monitor Nvidia's (N: NVDA) sustained growth in its data
Shop related →

Investing books
Read the classics
Shop this pick →

Personal finance books
Run the household books
Shop this pick →

Trading notebooks
Write the thesis first
Shop this pick →

Monitor for charts
See every pane
Shop this pick →
Story playbook
A pre-built map of what to watch — stocks, ETFs, and educational next steps. Not personalized advice.
Snapshot date: August 29, 2026 at 3:45 PM ET
This playbook was built when the story published and is not live-updated. Prices, news, and risk can change after this date — treat it as a starting map, not a current trade ticket.
Story → money map
AI chips
Nvidia's stock is being watched closely because it is very expensive on some measures, but its fast-growing data center business keeps impressing Wall Street. People who invest care because Nvidia leads the booming artificial intelligence chip market.
What changed
Analysts are balancing Nvidia's lofty price-to-sales ratio against rapid 106% revenue growth and a favorable forward P/E ratio.
Who wins / who loses
Nvidia and data center suppliers benefit from ongoing AI hardware demand, while competitors face immense pressure to keep up.
Time horizon
Think in terms of the next few weeks.
Confidence & best fit
medium confidence · Long-term investor
Safer theme exposure (ETFs)
Baskets that own the theme without betting on one company.
Single stocks (higher risk)
Primary = closest to the story · Peers = same industry · Second-order = knock-on effects · Avoid = looks related but may be a trap
Primary
- $NVDAWatch — track, don’t rush
The stock costs a lot compared to current sales, but expected future profits are helping hold the price steady.
View $NVDA chart → · End-of-day delayed data
Options (education only)
No strikes or expiries — a framework for how traders might express the view. Options can expire worthless.
Direction: volatile · Style: Covered-call income (only if you already own shares) · Level: intermediate
Beginners should skip options here; trading options on high-valuation stocks can be tricky if the price swings fast.
Income / OppHub America angle
Not a trade tip — ways to use the insight outside the market.
- Monitor broader tech sector capital expenditure reports from major cloud providers.
What would break this thesis
- A sudden slowdown in data center spending or a broader market sell-off in high-multiple tech stocks.
What to do next on OppHub America
Saved playbooks stay on this device for now.
Important
Not financial advice. OppHub America playbooks are educational market maps only — not recommendations to buy, sell, or hold any security. Markets move fast; information can be wrong or outdated. Trade and invest at your own risk. Do your own research or consult a licensed advisor.
Based on reporting from yahoo-tickers-tape-movers.
Informational and educational only — not investment, financial, or legal advice. Disclosure
Shares a vertical MP4 loop to your phone's camera roll or app share sheet (Instagram, TikTok, Facebook Reels).