Barry, OppHub America Desk · · Source: yahoo-tickers-tape-movers
Nvidia (NVDA) Stock Performance: Shares Up 22% YTD
If the broader market continues to show high volatility, investors may consider monitoring Nvidia (N: ) for potential support testing or consolidation around its moving averages. Its current of 46 suggests room for movement in either direction.
Based on reporting from yahoo-tickers-tape-movers.
Nvidia (NASDAQ: NVDA) shares have advanced 22% year-to-date, marking a period of more subdued performance following significant gains in prior years. This trajectory continues to draw market attention, particularly as analysts assess the durability of the AI infrastructure buildout. Investors are closely monitoring the chipmaker's performance as market dynamics shift.
Market context for this story
As of: After HoursLoading quotes…
Informational only — not investment advice. Full markets →

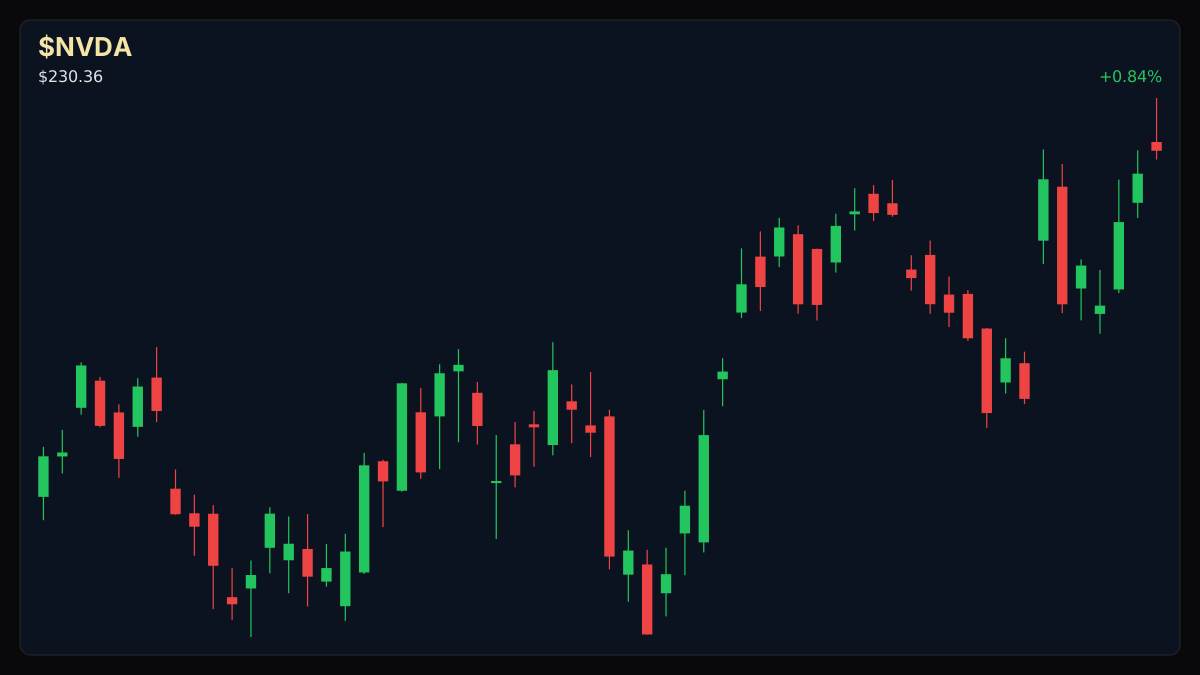
$NVDA
TradingView
Live chart & market data via TradingView · OppHub classroom · Delayed or exchange real-time per TradingView data agreements · Not investment advice
Educational TradingView chart — search any symbol in the widget. Confirm on /markets/NVDA. Not investment advice.
Related markets
Shares a vertical MP4 loop to your phone's camera roll or app share sheet (Instagram, TikTok, Facebook Reels).
Nvidia (NASDAQ: NVDA) shares have advanced 22% year-to-date, indicating a more tempered growth phase compared to its previous high-flying periods. The ongoing market discussion centers on the sustainability of the artificial intelligence infrastructure expansion and its profitability implications for chipmakers like Nvidia.
### Money Play Investors tracking the semiconductor sector may consider monitoring Nvidia (NASDAQ: NVDA) for continued performance trends, particularly given its 22% year-to-date gain and recent trading dynamics.
## Catalyst Analysis: Year-to-Date Performance Nvidia's 22% year-to-date share price increase reflects a period of stabilization after prior rapid appreciation. This performance is set against a backdrop where market participants are evaluating the long-term viability and profitability of extensive AI infrastructure investments, a key driver for Nvidia's business. The focus for investors remains on how these broader themes translate into sustained growth for the company.
## Technical Analysis & Key Risk Watch Nvidia (NASDAQ: NVDA) last traded at $208.48, experiencing a -2.91% daily move with trading volume at 1.16 times its 20-day average. The stock's RSI14 stands at 46, indicating a neutral momentum stance. Key levels for $NVDA+WL (educational): R2 $210.47 · R1 $208.65 · last $208.48 · S1 $208.34 · S2 $206.50. Its price is currently trading just above its 50-day simple moving average of $207.65 and well above its 200-day simple moving average of $195.34.
## Impact on Semiconductor Sector Nvidia's performance often serves as a bellwether for the broader semiconductor industry, especially those companies deeply embedded in the AI supply chain. Its more moderate year-to-date gain, following previous surges, could signal a sector-wide shift towards more stable, albeit slower, growth as the AI buildout matures. Investors in related technology and chip manufacturing firms may observe Nvidia's trajectory for broader market cues.
### Story Arc / How We Got Here This update follows prior observations of Nvidia's market activity. On Friday, August 28, 2026, Nvidia (NASDAQ: NVDA) was noted for experiencing significant price movements and volatility within technology sectors. Investors were monitoring the chipmaker's performance amid broader market dynamics and recent activity in AI-linked equities, with its RSI indicating neutral territory at that time. For more context, see our previous coverage: [Nvidia (NVDA) Weekend Market Context and Volatility](/explore/nvidia-nvda-weekend-market-context-volatility).
Read the full story
Original reporting and related coverage — attribution links only, not paid recommendations.
Trade this story
 Robinhood
 Webull
 Tradier
 IBKR
IBKR
Chart this story
 TradingView
Broker and exchange buttons use invite / refer-a-friend links (rewards may be capped). Charting links (TradingView) are partner offers that may pay OppHub America a commission at no extra cost to you.
OppSHOP
Full OppSHOP →As an Amazon Associate, OppHub America earns from qualifying purchases. Shopping here helps keep the site free — at no extra cost to you. Disclosure

OppSHOP
Related to this story
If the broader market continues to show high volatility, investors may c
Shop related →

Investing books
Read the classics
Shop this pick →

Personal finance books
Run the household books
Shop this pick →

Trading notebooks
Write the thesis first
Shop this pick →

Monitor for charts
See every pane
Shop this pick →
Story playbook
A pre-built map of what to watch — stocks, ETFs, and educational next steps. Not personalized advice.
Snapshot date: September 5, 2026 at 3:55 AM ET
This playbook was built when the story published and is not live-updated. Prices, news, and risk can change after this date — treat it as a starting map, not a current trade ticket.
Story → money map
AI infrastructure stabilization
Nvidia's stock has grown a solid 22% this year, but growth has slowed down as people question how long the huge AI boom can last. Investors are keeping a close eye on the stock to see if it will hold its current price or drop further.
What changed
Nvidia entered a more tempered growth phase with a 22% YTD gain as markets debate the ongoing profitability and durability of the AI infrastructure buildout.
Who wins / who loses
Diversified semiconductor ETFs and cautious chip investors benefit from reduced volatility, while aggressive growth chasers face higher consolidation risks.
Time horizon
Think in terms of the next few weeks.
Confidence & best fit
medium confidence · Long-term investor, Active trader
Safer theme exposure (ETFs)
Baskets that own the theme without betting on one company.
Single stocks (higher risk)
Primary = closest to the story · Peers = same industry · Second-order = knock-on effects · Avoid = looks related but may be a trap
Primary
- $NVDAWatch — track, don’t rush
Nvidia is taking a breather after big gains; it is best to watch and wait to see which way the stock breaks.
View $NVDA chart → · End-of-day delayed data
Peer
- $AMDWatch — track, don’t rush
Competitors like AMD will move up or down based on the same overall demand for AI computer chips.
View $AMD chart → · End-of-day delayed data
Second-order
- $TSMWatch — track, don’t rush
The company that manufactures these chips will feel the impact if AI demand slows down or speeds up.
View $TSM chart → · End-of-day delayed data
Options (education only)
No strikes or expiries — a framework for how traders might express the view. Options can expire worthless.
Direction: range · Style: Covered-call income (only if you already own shares) · Level: intermediate
If you already own the stock, you can make a little extra money selling the right for someone else to buy it at a higher price. Beginners should skip this until comfortable.
Income / OppHub America angle
Not a trade tip — ways to use the insight outside the market.
- Monitor broader cloud computing capital expenditure reports for early signals on AI hardware demand.
What would break this thesis
- A sharp breakdown below key support levels accompanied by heavy volume.
What to do next on OppHub America
Saved playbooks stay on this device for now.
Important
Not financial advice. OppHub America playbooks are educational market maps only — not recommendations to buy, sell, or hold any security. Markets move fast; information can be wrong or outdated. Trade and invest at your own risk. Do your own research or consult a licensed advisor.
Based on reporting from yahoo-tickers-tape-movers.
Informational and educational only — not investment, financial, or legal advice. Disclosure
Shares a vertical MP4 loop to your phone's camera roll or app share sheet (Instagram, TikTok, Facebook Reels).