Barry, OppHub America Desk · · Source: yahoo-tickers-tape-movers
Nvidia Stock: Erases $1.3T in Market Value After 5th Losing Week
Export controls and industrial policy are direct semis catalysts: watch $NVDA+WL as supply constraints and regulatory headwinds test technical support levels.
Based on reporting from yahoo-tickers-tape-movers.
Nvidia Corporation (NASDAQ: NVDA) suffered its fifth consecutive losing week, dropping 22% from its October record and shedding about $1.27 trillion in market value. Traders face severe semiconductor sector consolidation as political shifts and data center headwinds pressure high-multiple artificial intelligence hardware leaders.
Market context for this story
As of: WeekendLoading quotes…
Informational only — not investment advice. Full markets →


$SPYSPDR S&P 500 ETF
TradingView
Live chart & market data via TradingView · OppHub classroom · Delayed or exchange real-time per TradingView data agreements · Not investment advice
$AMD
TradingView
Live chart & market data via TradingView · OppHub classroom · Delayed or exchange real-time per TradingView data agreements · Not investment advice
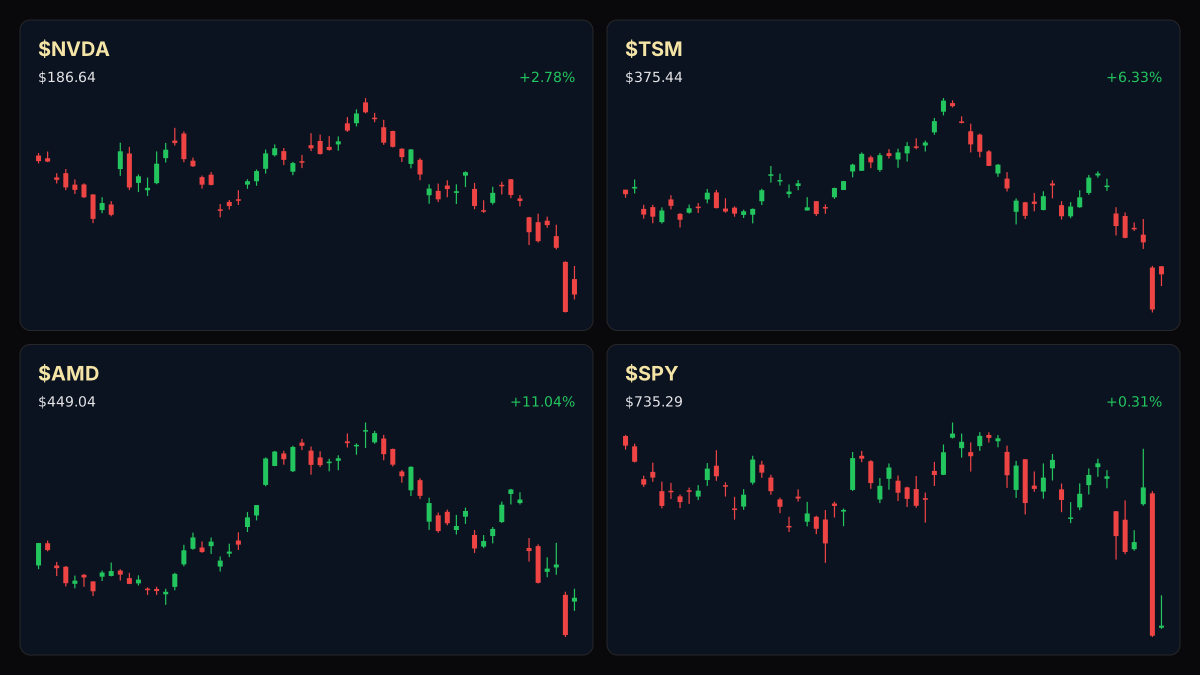
Educational TradingView charts — search any symbol in the widget. Confirm on /markets/SPY and related $AMD, $NVDA, $TSM. Not investment advice.
Related markets
Shares a vertical MP4 loop to your phone's camera roll or app share sheet (Instagram, TikTok, Facebook Reels).
Nvidia Corporation (NASDAQ: NVDA) suffered its fifth consecutive losing week, dropping 22% from its October record and shedding about $1.27 trillion in market value as political shifts and data center headwinds pressured semiconductor equities.
### Money Play - Export controls and industrial policy are direct semiconductor catalysts: watch $NVDA+WL as supply constraints and regulatory headwinds test technical support levels.
### Executive Thesis The semiconductor sector faces severe profit-taking consolidation and risk-off rotation following a historic multi-year expansion cycle. With political campaigns and legislative shifts in Washington focusing on artificial intelligence infrastructure, market participants are reassessing hardware deployment timelines and valuation multiples across major chipmakers.
### The Print vs Consensus - Nvidia shares closed at $186.71 on Friday, November 6, 2026, after a $5.11 gain (+2.81%), but the weekly retreat erased about $433 billion alone. - The stock sits 21.96% below its record $239.24 close on October 6, 2026, creating a gap of $52.53 per share across 24.15 billion shares outstanding. - The PHLX Semiconductor Index fell 12.15% for the week, closing 35.84% below its June 22, 2026 record and extending its bear market decline.
### Market Reaction Broader equity benchmarks absorbed sharp tech-sector outflows, with the S&P 500 losing 2.68% and the Nasdaq Composite losing 3.37% over the week. Selling pressure concentrated heavily in artificial intelligence infrastructure names, culminating in an 8.76% weekly drop for Nvidia and a 9.26% single-day pullback on November 5, 2026.
### What It Means for Policy & Positioning Legislative debates surrounding artificial intelligence data centers and export controls have introduced fresh regulatory uncertainty into capital expenditure models. Traders are evaluating whether multiple compression will persist or if oversold bounce conditions can take hold ahead of upcoming corporate earnings releases.
### Story Arc / How We Got Here As evaluated in our prior coverage on Nvidia hardware deployment at /explore/nvidia-hardware-deployment-assessing-long-term-ai-infrastructure, dominant graphics processing unit positioning underpins long-term data center expansion. However, the transition from multi-year deployment cycles to near-term political scrutiny has accelerated volatility across hardware leaders.
### Next Calendar Watch Watch for upcoming corporate earnings reports scheduled for November 17, 2026, which will provide updated guidance on infrastructure demand and supply constraints.
Read the full story
Original reporting and related coverage — attribution links only, not paid recommendations.
Trade this story
 Robinhood
 Webull
 Tradier
 IBKR
Chart this story
 TradingView
Broker and exchange buttons use invite / refer-a-friend links (rewards may be capped). Charting links (TradingView) are partner offers that may pay OppHub America a commission at no extra cost to you.
OppSHOP
Full OppSHOP →As an Amazon Associate, OppHub America earns from qualifying purchases. Shopping here helps keep the site free — at no extra cost to you. Disclosure

OppSHOP
Related to this story
Export controls and industrial policy are direct semis catalysts: watch
Shop related →

Investing books
Read the classics
Shop this pick →

Personal finance books
Run the household books
Shop this pick →

Trading notebooks
Write the thesis first
Shop this pick →

Monitor for charts
See every pane
Shop this pick →
Story playbook
A pre-built map of what to watch — stocks, ETFs, and educational next steps. Not personalized advice.
Snapshot date: November 7, 2026 at 9:46 AM ET
This playbook was built when the story published and is not live-updated. Prices, news, and risk can change after this date — treat it as a starting map, not a current trade ticket.
Story → money map
AI chip correction
Nvidia's stock dropped sharply over five weeks, losing a huge amount of its total value as investors worried about politics and slowing spending on artificial intelligence hardware. People care because chipmakers drive the broader stock market, so their drops pull down other investments too.
What changed
Nvidia and the broader semiconductor sector suffered a historic multi-week selloff amid political shifts and data center headwinds.
Who wins / who loses
Diversified technology funds and cash-heavy investors benefit from lower entry prices, while leveraged AI hardware leaders and recent stock buyers are hurt.
Time horizon
Think in terms of the next few weeks.
Confidence & best fit
medium confidence · Long-term investor, Active trader
Safer theme exposure (ETFs)
Baskets that own the theme without betting on one company.
Single stocks (higher risk)
Primary = closest to the story · Peers = same industry · Second-order = knock-on effects · Avoid = looks related but may be a trap
Primary
- $NVDAWatch — track, don’t rush
The main chipmaker whose stock price has dropped significantly, making it important to watch for a bottom.
View $NVDA chart → · End-of-day delayed data
Peer
- $TSMWatch — track, don’t rush
The company that manufactures most of these high-end chips, feeling the impact of slowing demand.
View $TSM chart → · End-of-day delayed data
Options (education only)
No strikes or expiries — a framework for how traders might express the view. Options can expire worthless.
Direction: volatile · Style: Protective put / downside hedge idea · Level: intermediate
Beginners should skip options here because rapid price swings can make complex trades expensive and unpredictable.
Income / OppHub America angle
Not a trade tip — ways to use the insight outside the market.
- Monitor regional economic development linked to domestic semiconductor manufacturing and export control legislation.
What would break this thesis
- A sudden rebound in semiconductor index records or a rapid reversal of regulatory headwinds would invalidate this cautious thesis.
What to do next on OppHub America
Saved playbooks stay on this device for now.
Important
Not financial advice. OppHub America playbooks are educational market maps only — not recommendations to buy, sell, or hold any security. Markets move fast; information can be wrong or outdated. Trade and invest at your own risk. Do your own research or consult a licensed advisor.
Based on reporting from yahoo-tickers-tape-movers.
Informational and educational only — not investment, financial, or legal advice. Disclosure
Shares a vertical MP4 loop to your phone's camera roll or app share sheet (Instagram, TikTok, Facebook Reels).