OppHub America Desk · · Source: yahoo-tickers-tape-movers
Nvidia Stock Faces Volatile Tape and Technical Support Test
If volatility persists around semiconductor leadership transitions, watch $NVDA+WL for potential range consolidation near key moving averages and support thresholds.
Based on reporting from yahoo-tickers-tape-movers.
Nvidia shares experienced a tumultuous week of trading following leadership changes and broader semiconductor sector pressures. Investors are closely monitoring key support levels as volume dynamics shift across artificial intelligence hardware leaders.
Market context for this story
As of: WeekendLoading quotes…
Informational only — not investment advice. Full markets →


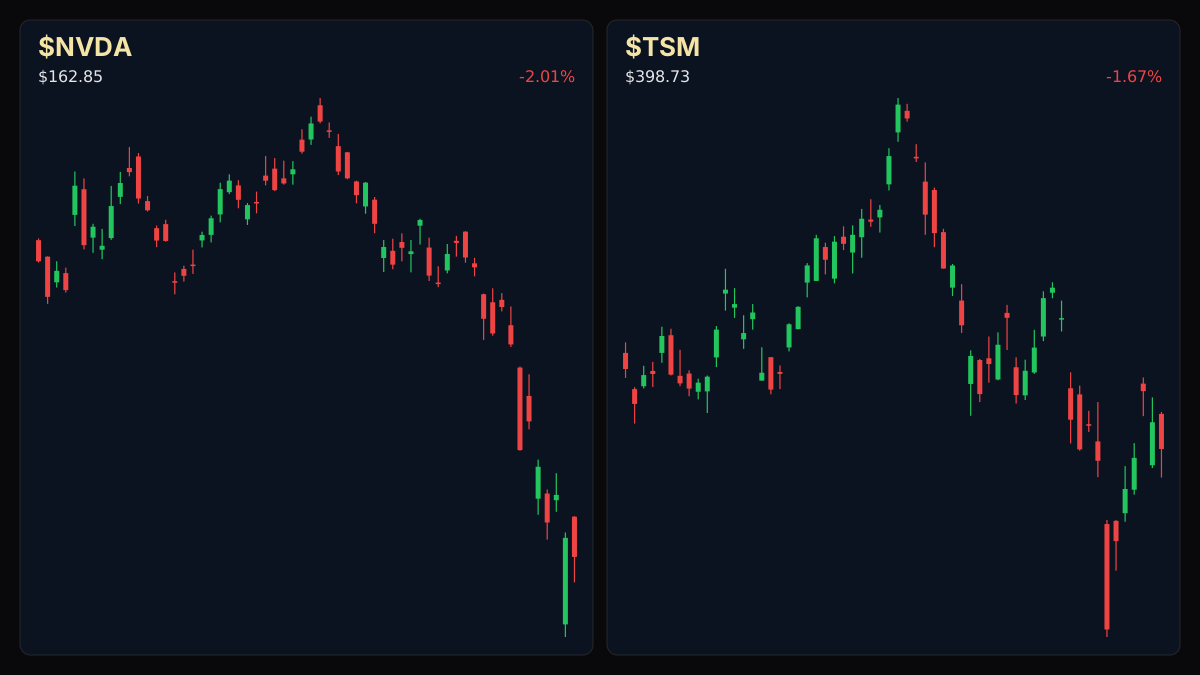
$NVDA
TradingView
Live chart & market data via TradingView · OppHub classroom · Delayed or exchange real-time per TradingView data agreements · Not investment advice
$TSM
TradingView
Live chart & market data via TradingView · OppHub classroom · Delayed or exchange real-time per TradingView data agreements · Not investment advice
Educational TradingView charts — search any symbol in the widget. Confirm on /markets/NVDA and related $TSM, $MSFT, $AAPL. Not investment advice.
Related markets
Shares a vertical MP4 loop to your phone's camera roll or app share sheet (Instagram, TikTok, Facebook Reels).
### Money Play If volatility persists around semiconductor leadership transitions, watch $NVDA+WL for potential range consolidation near key moving averages and support thresholds.
### Session Tape - $NVDA+WL: last $202.06 (-1.26% day) - $MSFT+WL: last $507.12 (-2.83% day) - $AAPL+WL: last $342.37 (-0.52% day)
## Catalyst Analysis: Leadership Transition & Sector Pressure Nvidia Corporation (NASDAQ: NVDA) navigated a turbulent stretch of sessions following structural and leadership adjustments. Market participants reevaluated semiconductor sector multiples amid shifting macroeconomic conditions and heavy volume rotation across the artificial intelligence hardware ecosystem.
### Story Arc / How We Got Here Today's price action extends a broader period of sector consolidation following heavy losses earlier in the quarter, when high-multiple artificial intelligence leaders erased significant market value amid shifting regulatory and supply constraints, as detailed in our prior coverage at /explore/nvidia-stock-erases-13t-in-market-value-after-5th-losing-week.
## $NVDA+WL Technical Analysis & Key Risk Watch With an RSI14 reading of 26.9, $NVDA+WL trades in oversold territory with a 20-day volume multiple of 1.17x. Key levels for $NVDA+WL (educational): R2 $213.85 · R1 $209.06 · last $202.06 · S1 $201.66 · S2 $200.92.
## Impact on Related Tickers Broader mega-cap technology issues experienced sympathetic movement during the session, with $MSFT+WL registering a 2.83% pullback and $AAPL+WL easing 0.52% as traders reassessed risk exposure across high-valuation growth equities.
Read the full story
Original reporting and related coverage — attribution links only, not paid recommendations.
Trade this story
 Robinhood
 Webull
 Tradier
 IBKR
Chart this story
 TradingView
Broker and exchange buttons use invite / refer-a-friend links (rewards may be capped). Charting links (TradingView) are partner offers that may pay OppHub America a commission at no extra cost to you.
OppSHOP
Full OppSHOP →As an Amazon Associate, OppHub America earns from qualifying purchases. Shopping here helps keep the site free — at no extra cost to you. Disclosure

OppSHOP
Related to this story
If volatility persists around semiconductor leadership transitions, watc
Shop related →

Investing books
Read the classics
Shop this pick →

Personal finance books
Run the household books
Shop this pick →

Trading notebooks
Write the thesis first
Shop this pick →

Monitor for charts
See every pane
Shop this pick →
Based on reporting from yahoo-tickers-tape-movers.
Informational and educational only — not investment, financial, or legal advice. Disclosure
Shares a vertical MP4 loop to your phone's camera roll or app share sheet (Instagram, TikTok, Facebook Reels).