Barry, OppHub America Desk · · Source: yahoo-tickers-tape-movers
Nvidia Stock Plunge Stirs 401(k) Risks Amid Leadership Scrutiny
If $NVDA+WL holds near S1 ($201.66) support with an oversold of 26.9, watch for potential mean-reversion bounces or volatility-driven accumulation.
Based on reporting from yahoo-tickers-tape-movers.
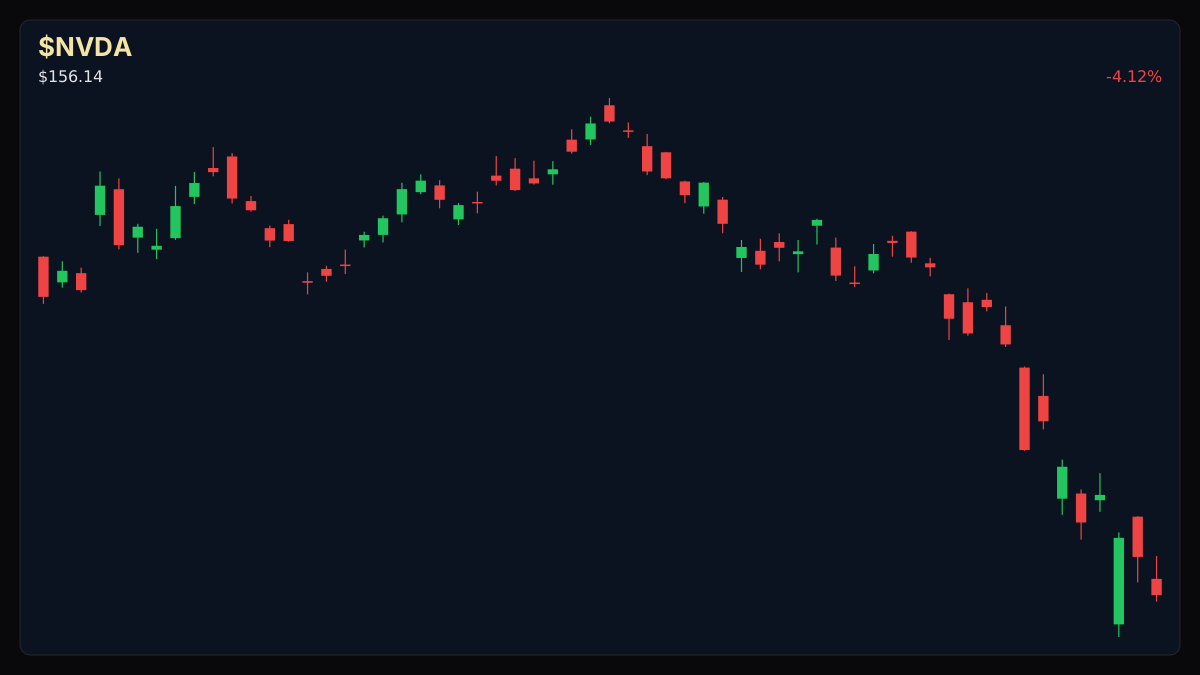
Nvidia shares slipped 1.26% as leadership scrutiny highlights concentrated technology exposure across retirement portfolios. Investors tracking $NVDA+WL navigate heightened volatility with RSI leaning oversold at 26.9.
Market context for this story
As of: After HoursLoading quotes…
Informational only — not investment advice. Full markets →

$NVDA
TradingView
Live chart & market data via TradingView · OppHub classroom · Delayed or exchange real-time per TradingView data agreements · Not investment advice
Educational TradingView chart — search any symbol in the widget. Confirm on /markets/NVDA. Not investment advice.
Related markets
Shares a vertical MP4 loop to your phone's camera roll or app share sheet (Instagram, TikTok, Facebook Reels).
Nvidia (NASDAQ: NVDA) shares faced renewed pressure, retreating 1.26% to close at $202.06 on Monday, November 16, 2026, as ongoing executive scrutiny underscores concentrated technology exposure in household retirement accounts.
### Money Play If $NVDA+WL remains under pressure near key support levels with an oversold RSI of 26.9, traders should monitor positioning around the $200.92-$201.66 S2-S1 band for potential mean-reversion setups.
### Catalyst Analysis: Key Man Risk and Portfolio Exposure The recent pullback in $NVDA+WL brings structural concentration risks to the forefront for market participants holding large-cap growth vehicles. As artificial intelligence bellwether holdings dominate equity allocations, single-stock leadership questions ripple directly into broader index performance and passive investment strategies.
### Technical Analysis & Key Risk Watch Volume ran at 1.17x the 20-day average during the session. Key levels for $NVDA+WL (educational): R2 $213.85 · R1 $209.06 · last $202.06 · S1 $201.66 · S2 $200.92. The 14-day Relative Strength Index prints at 26.9, putting the semiconductor leader into oversold territory while trading below its 50-day moving average of $221.50 and 200-day moving average of $204.46.
### Story Arc / How We Got Here This session follows earlier developments on Monday, November 9, 2026, when leadership scrutiny and governance questions began testing the resilience of the broader artificial intelligence trade. For a detailed look at how congressional attention and export debates initially shaped this narrative, review our prior coverage at /explore/nvidia-ceo-probe-tests-ai-trade-resilience-key-man-risk-looms.
### Impact on Tech Allocations Concentrated tech weightings in major indices mean headline-driven sell-offs in $NVDA+WL propagate swiftly across broader growth portfolios, testing risk tolerance among institutional and retail participants alike.
Read the full story
Original reporting and related coverage — attribution links only, not paid recommendations.
Trade this story
 Robinhood
 Webull
 Tradier
 IBKR
Chart this story
 TradingView
Broker and exchange buttons use invite / refer-a-friend links (rewards may be capped). Charting links (TradingView) are partner offers that may pay OppHub America a commission at no extra cost to you.
OppSHOP
Full OppSHOP →As an Amazon Associate, OppHub America earns from qualifying purchases. Shopping here helps keep the site free — at no extra cost to you. Disclosure

OppSHOP
Related to this story
If $NVDA holds near S1 ($201.66) support with an oversold of 26.9, watch
Shop related →

Investing books
Read the classics
Shop this pick →

Personal finance books
Run the household books
Shop this pick →

Trading notebooks
Write the thesis first
Shop this pick →

Monitor for charts
See every pane
Shop this pick →
Story playbook
A pre-built map of what to watch — stocks, ETFs, and educational next steps. Not personalized advice.
Snapshot date: November 16, 2026 at 7:26 PM ET
This playbook was built when the story published and is not live-updated. Prices, news, and risk can change after this date — treat it as a starting map, not a current trade ticket.
Story → money map
AI chip concentration risk
Nvidia stock dipped slightly as people worry about retirement accounts having too much tech stock. Investors are watching to see if the stock price hits a floor and bounces back up.
What changed
Nvidia shares retreated to $202.06 amid executive scrutiny and concentrated retirement portfolio risks.
Who wins / who loses
Diversified index funds and broader market hedges benefit from tech concentration fears, while concentrated tech holders face immediate downside pressure.
Time horizon
Think in terms of next few days.
Confidence & best fit
medium confidence · Active trader
Safer theme exposure (ETFs)
Baskets that own the theme without betting on one company.
Single stocks (higher risk)
Primary = closest to the story · Peers = same industry · Second-order = knock-on effects · Avoid = looks related but may be a trap
Primary
- $NVDAWatch — track, don’t rush
The stock has dropped a lot quickly, so traders are waiting to see if it stops falling and bounces back.
View $NVDA chart → · End-of-day delayed data
Peer
- $AMDStay away — for now
Competitor stocks often drop too when the biggest player in the industry faces bad news.
View $AMD chart → · End-of-day delayed data
Second-order
- $QQQProtect — reduce risk
A basket of big tech companies that might drop if Nvidia drags down the whole tech sector.
View $QQQ chart → · End-of-day delayed data
Options (education only)
No strikes or expiries — a framework for how traders might express the view. Options can expire worthless.
Beginners should skip options right now because the stock is moving unpredictably.
See options-friendly brokers →Income / OppHub America angle
Not a trade tip — ways to use the insight outside the market.
- Review your 401(k) allocations to ensure single-stock tech exposure does not exceed your risk tolerance.
What would break this thesis
- A decisive break below the S2 support level of $200.92 with heavy volume would invalidate the bounce thesis.
What to do next on OppHub America
Saved playbooks stay on this device for now.
Important
Not financial advice. OppHub America playbooks are educational market maps only — not recommendations to buy, sell, or hold any security. Markets move fast; information can be wrong or outdated. Trade and invest at your own risk. Do your own research or consult a licensed advisor.
Based on reporting from yahoo-tickers-tape-movers.
Informational and educational only — not investment, financial, or legal advice. Disclosure
Shares a vertical MP4 loop to your phone's camera roll or app share sheet (Instagram, TikTok, Facebook Reels).