Barry, OppHub America Desk · · Source: yahoo-tickers-tape-movers
NVIDIA Stock Slip: Tape Tucks in Amid Multi-Asset Tape Shifts
If tests immediate support at $201.66, watch equity and options volume for institutional reversal signals or continued downside momentum.
Based on reporting from yahoo-tickers-tape-movers.
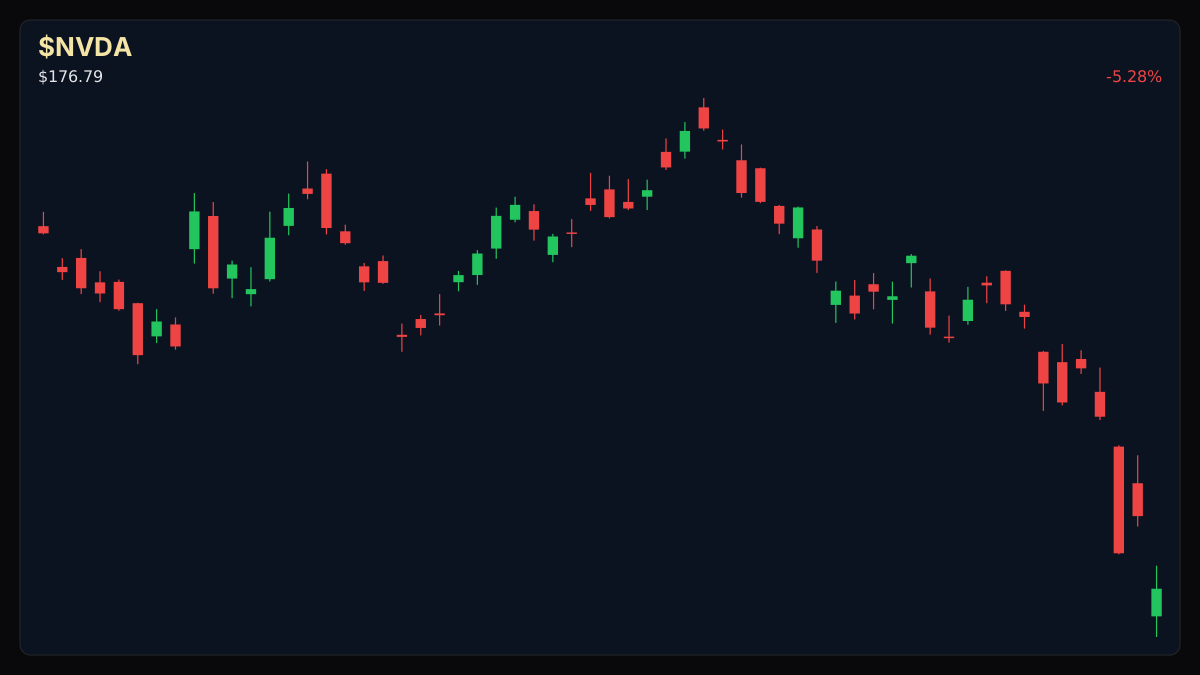
Nvidia (NASDAQ: NVDA) shares pulled back 1.26% on Monday, November 9, 2026, touching $202.06 as broader digital asset and equity tape movers flashed mixed cross-market action. Traders are weighing oversold momentum conditions against shifting institutional risk appetite across mega-cap tech infrastructure.
Market context for this story
As of: Regular HoursLoading quotes…
Informational only — not investment advice. Full markets →


$NVDA
TradingView
Live chart & market data via TradingView · OppHub classroom · Delayed or exchange real-time per TradingView data agreements · Not investment advice
Educational TradingView chart — search any symbol in the widget. Confirm on /markets/NVDA and related $AMZN. Not investment advice.
Related markets
Shares a vertical MP4 loop to your phone's camera roll or app share sheet (Instagram, TikTok, Facebook Reels).
Nvidia (NASDAQ: NVDA) shares drifted 1.26% lower to $202.06 during Monday's regular trading session, reflecting broader technical consolidation across major growth and digital asset tape benchmarks. With 14-day RSI sliding into oversold territory at 26.9, market participants are closely scrutinizing whether current price levels offer accumulation zones or precede deeper mean reversion toward the 200-day moving average.
### Tape / Session Read Intraday tape action showed broader mega-cap semiconductor softness alongside mixed cross-asset prints. Volume multiples hovered at 1.17x the 20-day average, signaling moderate institutional participation rather than panic liquidation as prices tested immediate support thresholds.
### Why This Lane Matters Semiconductor leadership sets the tone for broader index risk appetite. When bellwether AI hardware names experience oversold momentum readings, downstream impacts ripple across technology-heavy growth vehicles and passive equity structures, altering short-term hedging demand.
### Money Play If $NVDA+WL sustains pressure near immediate technical support, watch $NVDA+WL options chains and underlying equity flow to gauge whether institutional block desks step in or defensive collar strategies expand.
### Story Arc / How We Got Here Today's technical pullback follows earlier autumn tape volatility where hyperscaler capital expenditure estimates and sector rotation drove heightened scrutiny across AI hardware leaders, as previously detailed in our coverage of JPMorgan capital estimates and tech positioning (/explore/ceo-desk-jpmorgan-capital-estimates-spark-amazon-and-mcdonalds-focus).
## $NVDA+WL Technical Analysis & Key Risk Watch — LIVE MARKET CONTEXT Key levels for $NVDA+WL (educational): R2 $213.85 · R1 $209.06 · last $202.06 · S1 $201.66 · S2 $200.92. Trading below its 50-day moving average of $221.50 and hovering near the 200-day moving average of $204.46, the equity exhibits near-term downward momentum with an RSI14 of 26.9.
Read the full story
Original reporting and related coverage — attribution links only, not paid recommendations.
Trade this story (crypto)
 Coinbase
 Gemini
 Robinhood
 Webull
Chart this story
 TradingView
Broker and exchange buttons use invite / refer-a-friend links (rewards may be capped). Charting links (TradingView) are partner offers that may pay OppHub America a commission at no extra cost to you.
OppSHOP
Full OppSHOP →As an Amazon Associate, OppHub America earns from qualifying purchases. Shopping here helps keep the site free — at no extra cost to you. Disclosure

OppSHOP
Related to this story
If tests immediate support at $201.66, watch equity and options volume f
Shop related →

Investing books
Read the classics
Shop this pick →

Personal finance books
Run the household books
Shop this pick →

Trading notebooks
Write the thesis first
Shop this pick →

Monitor for charts
See every pane
Shop this pick →
Story playbook
A pre-built map of what to watch — stocks, ETFs, and educational next steps. Not personalized advice.
Snapshot date: November 9, 2026 at 2:00 PM ET
This playbook was built when the story published and is not live-updated. Prices, news, and risk can change after this date — treat it as a starting map, not a current trade ticket.
Story → money map
AI hardware consolidation
Nvidia stock dipped slightly while technical indicators hit oversold levels, meaning it might be temporarily cheap. Investors are watching to see if big institutions step in to buy or if the price drops further.
What changed
Nvidia shares slipped into oversold momentum territory near immediate technical support levels.
Who wins / who loses
Short-term hedgers and patient buyers benefit from potential entry points, while momentum traders face immediate downside risk.
Time horizon
Think in terms of the next few weeks.
Confidence & best fit
medium confidence · Active trader
Safer theme exposure (ETFs)
Baskets that own the theme without betting on one company.
Single stocks (higher risk)
Primary = closest to the story · Peers = same industry · Second-order = knock-on effects · Avoid = looks related but may be a trap
Primary
- $NVDAWatch — track, don’t rush
The main stock in the news is testing a crucial price floor, so we are watching to see what happens next.
View $NVDA chart → · End-of-day delayed data
Peer
- $AMDWatch — track, don’t rush
Other chip stocks often move in the same direction as Nvidia.
View $AMD chart → · End-of-day delayed data
- $AVGOWatch — track, don’t rush
Another major chipmaker affected by overall tech sector mood.
View $AVGO chart → · End-of-day delayed data
Second-order
- $MSFTWatch — track, don’t rush
Big technology buyers whose spending habits affect chipmaker revenues.
View $MSFT chart → · End-of-day delayed data
Options (education only)
No strikes or expiries — a framework for how traders might express the view. Options can expire worthless.
Direction: volatile · Style: Protective put / downside hedge idea · Level: intermediate
Beginners should skip options here; more advanced traders can use protective puts to guard against further price drops.
Income / OppHub America angle
Not a trade tip — ways to use the insight outside the market.
- Review hardware upgrade cycles for localized tech supply chains.
What would break this thesis
- A high-volume breakdown below immediate support levels or a sudden shift in hyperscaler capital expenditure outlooks.
What to do next on OppHub America
Saved playbooks stay on this device for now.
Important
Not financial advice. OppHub America playbooks are educational market maps only — not recommendations to buy, sell, or hold any security. Markets move fast; information can be wrong or outdated. Trade and invest at your own risk. Do your own research or consult a licensed advisor.
Based on reporting from yahoo-tickers-tape-movers.
Informational and educational only — not investment, financial, or legal advice. Disclosure
Shares a vertical MP4 loop to your phone's camera roll or app share sheet (Instagram, TikTok, Facebook Reels).