Barry, OppHub America Desk · · Source: cnbc-economy
October CPI Print: Headline Inflation Rises 0.6% MoM, +3.7% YoY
Monitor short-end duration risk and fixed-income positioning as rate-cut probabilities adjust to the hotter headline inflation print.
Based on reporting from cnbc-economy.
Headline consumer inflation rose 0.6% on a seasonally adjusted basis in October, with the 12-month index climbing 3.7%, as markets braced for the official Bureau of Labor Statistics release on Tuesday, November 10, 2026. Traders and institutional desks are recalibrating interest rate expectations following the hotter-than-expected headline print.
Market context for this story
As of: After HoursLoading quotes…
Informational only — not investment advice. Full markets →
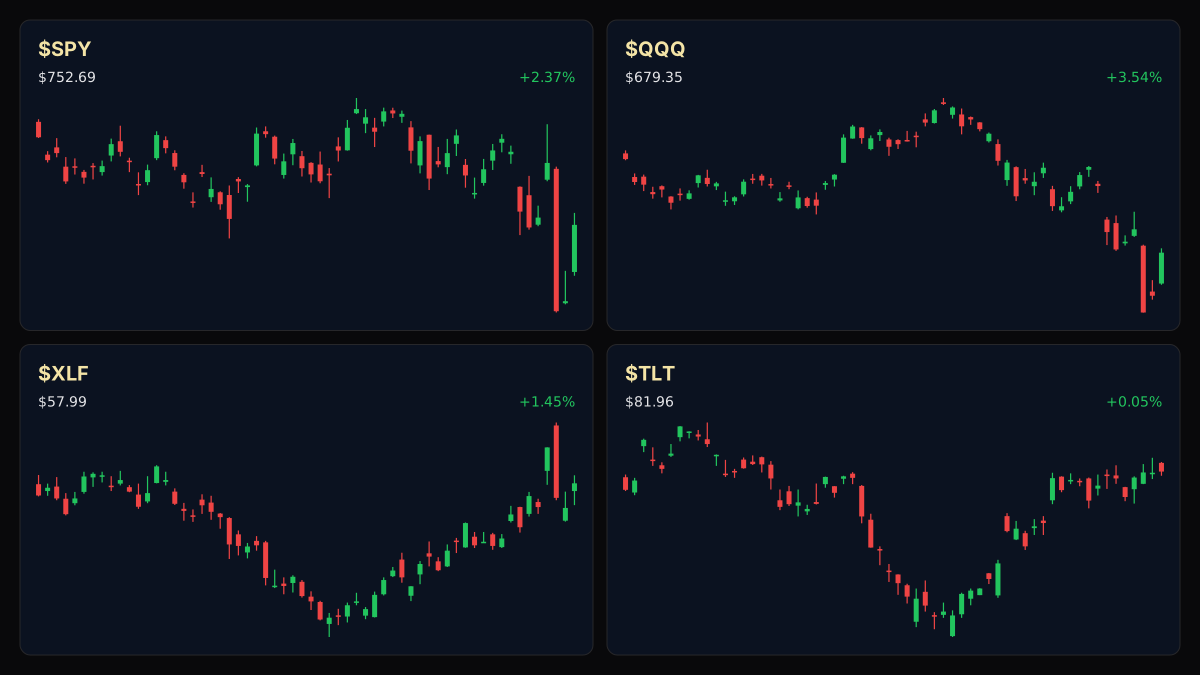
 SPDR S&P 500 ETF·$SPY
 Invesco QQQ Trust·$QQQ
 iShares 20+ Year Treasury·$TLT
 Financial Select Sector·$XLF
$SPYSPDR S&P 500 ETF
TradingView
Live chart & market data via TradingView · OppHub classroom · Delayed or exchange real-time per TradingView data agreements · Not investment advice
$QQQInvesco QQQ Trust
TradingView
Live chart & market data via TradingView · OppHub classroom · Delayed or exchange real-time per TradingView data agreements · Not investment advice
Educational TradingView charts — search any symbol in the widget. Confirm on /markets/SPY and related $QQQ, $TLT, $XLF. Not investment advice.
Related markets
Shares a vertical MP4 loop to your phone's camera roll or app share sheet (Instagram, TikTok, Facebook Reels).
Headline consumer inflation increased 0.6% on a seasonally adjusted basis in October, according to official data released on Tuesday, November 10, 2026, bringing the 12-month rate to a 3.7% increase.
### Money Play Market participants navigating the inflation print should monitor short-end duration risk and positioning across fixed-income vehicles as rate-cut bets adjust to the 0.6% MoM headline increase.
### Executive Thesis The October Consumer Price Index print challenges prevailing disinflation narratives, forcing market makers and institutional desks to reprice the Federal Reserve's terminal rate path. With headline inflation running at 3.7% over the past 12 months, fixed-income portfolios face renewed volatility as higher-for-longer rate probabilities price back into the curve.
### The Print - **Headline MoM:** Increased 0.6% on a seasonally adjusted basis. - **Headline YoY:** All items index increased 3.7% over the last 12 months.
### Market Reaction Equities and bond futures reacted to the hotter monthly headline figure, with heightened volatility across rate-sensitive sectors as traders digested the 0.6% monthly expansion.
### What It Means for Policy & Positioning The hotter monthly reading complicates the Federal Reserve's dual-mandate balancing act, keeping rate-cut optionality constrained. Fixed-income desks are managing duration exposure while equity markets weigh multiple contraction risks amid elevated inflation persistence.
### Next Calendar Watch Watch for subsequent Producer Price Index and employment data releases scheduled through November 2026 to gauge secondary inflation transmission.
Read the full story
Original reporting and related coverage — attribution links only, not paid recommendations.
Trade this story
 Robinhood
 Webull
 Tradier
 IBKR
Chart this story
 TradingView
Broker and exchange buttons use invite / refer-a-friend links (rewards may be capped). Charting links (TradingView) are partner offers that may pay OppHub America a commission at no extra cost to you.
OppSHOP
Full OppSHOP →As an Amazon Associate, OppHub America earns from qualifying purchases. Shopping here helps keep the site free — at no extra cost to you. Disclosure

OppSHOP
Related to this story
Monitor short-end duration risk and fixed-income positioning as rate-cut
Shop related →

Investing books
Read the classics
Shop this pick →

Personal finance books
Run the household books
Shop this pick →

Trading notebooks
Write the thesis first
Shop this pick →

Monitor for charts
See every pane
Shop this pick →
Story playbook
A pre-built map of what to watch — stocks, ETFs, and educational next steps. Not personalized advice.
Snapshot date: November 9, 2026 at 5:30 PM ET
This playbook was built when the story published and is not live-updated. Prices, news, and risk can change after this date — treat it as a starting map, not a current trade ticket.
Story → money map
hotter inflation and rates
Inflation came in higher than expected last month, meaning prices are still rising faster than the Fed would like. Because of this, people with money in the market are bracing for interest rates to stay high for a longer time.
What changed
October headline CPI rose 0.6% MoM, pushing annual inflation to 3.7% and disrupting disinflation narratives.
Who wins / who loses
Short-duration fixed income and high-margin cash generators benefit from higher-for-longer rates, while rate-sensitive tech, housing, and long bonds are hurt.
Time horizon
Think in terms of the next few weeks.
Confidence & best fit
medium confidence · Active trader, Long-term investor
Safer theme exposure (ETFs)
Baskets that own the theme without betting on one company.
Single stocks (higher risk)
Primary = closest to the story · Peers = same industry · Second-order = knock-on effects · Avoid = looks related but may be a trap
Primary
- $JPMBuild slowly — only if it fits your plan
Big banks often make more money when interest rates stay high.
View $JPM chart → · End-of-day delayed data
Peer
- $XOMWatch — track, don’t rush
Energy companies often do well when overall prices go up.
View $XOM chart → · End-of-day delayed data
Second-order
- $PLDStay away — for now
Real estate companies can struggle when borrowing costs go up.
View $PLD chart → · End-of-day delayed data
Options (education only)
No strikes or expiries — a framework for how traders might express the view. Options can expire worthless.
Direction: volatile · Style: Protective put / downside hedge idea · Level: intermediate
Think of this like buying insurance on your investments just in case the stock market drops because of high inflation. Beginners should probably skip options here.
Income / OppHub America angle
Not a trade tip — ways to use the insight outside the market.
- Lock in high-yield savings accounts or short-term certificates of deposit before rate expectations shift further.
What would break this thesis
- Subsequent inflation prints showing a sharp resumption of the downward trend toward the 2% target.
What to do next on OppHub America
Saved playbooks stay on this device for now.
Important
Not financial advice. OppHub America playbooks are educational market maps only — not recommendations to buy, sell, or hold any security. Markets move fast; information can be wrong or outdated. Trade and invest at your own risk. Do your own research or consult a licensed advisor.
Based on reporting from cnbc-economy.
Informational and educational only — not investment, financial, or legal advice. Disclosure
Shares a vertical MP4 loop to your phone's camera roll or app share sheet (Instagram, TikTok, Facebook Reels).