OppHub America Desk · · Source: yahoo-tickers-tape-movers
Oracle Stock Nears Worst Calendar Year Since 2001 Slump
Historical drawdowns in legacy enterprise software providers highlight the friction between aggressive capital expenditures and higher borrowing costs. Investors tracking enterprise technology infrastructure should monitor corporate debt yields and free cash flow conversion rather than relying solely on top-line revenue growth rates.
Based on reporting from yahoo-tickers-tape-movers.
Oracle shares face a steep 42% slide through 2026, tracking historical drawdowns not seen since the tech bubble era. Investors are weighing capital expenditure costs against revenue acceleration as historical precedent offers mixed recovery signals.
Market context for this story
As of: After HoursLoading quotes…
Informational only — not investment advice. Full markets →

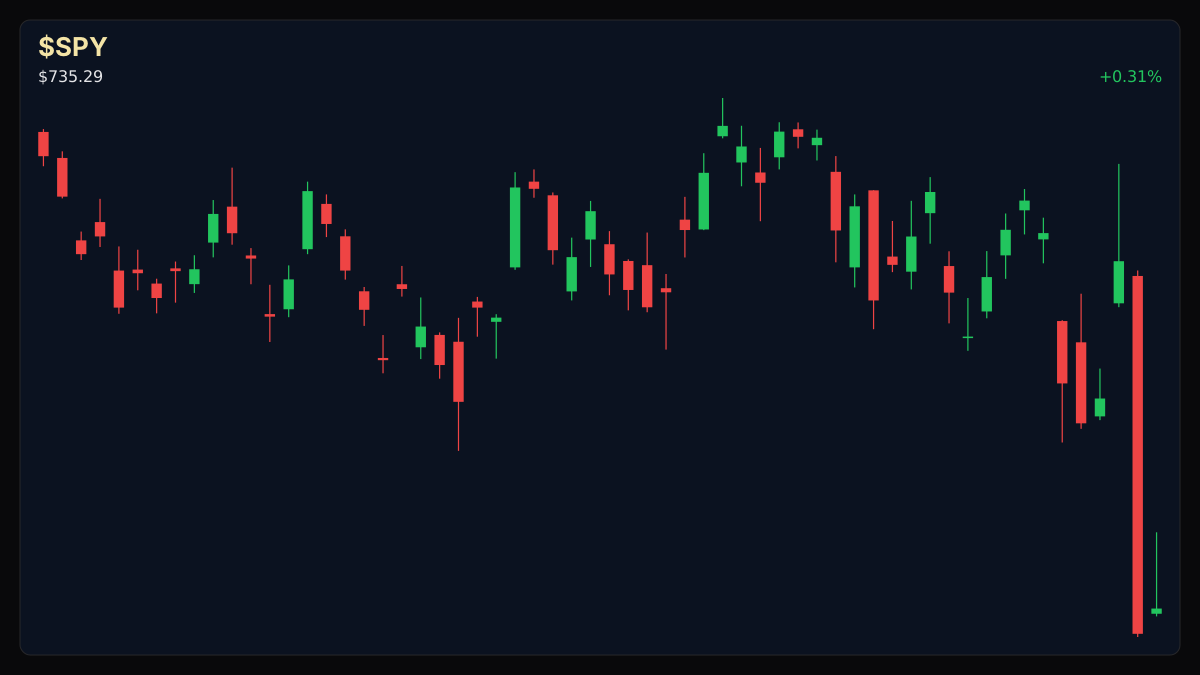
$SPYSPDR S&P 500 ETF
TradingView
Live chart & market data via TradingView · OppHub classroom · Delayed or exchange real-time per TradingView data agreements · Not investment advice
Educational TradingView chart — search any symbol in the widget. Confirm on /markets/SPY. Not investment advice.
Related markets
Shares a vertical MP4 loop to your phone's camera roll or app share sheet (Instagram, TikTok, Facebook Reels).
## Session Tape — Tape Movers
Oracle is pacing for a severe calendar-year contraction, shedding roughly 42% in 2026. Historical tape context shows previous comparable drops occurred during severe tech downturns, notably in 2001 and earlier structural corrections.
## Catalyst Analysis: Historical Precedent and Capital Demands
Oracle's current market trajectory reflects deep valuation pressure during 2026, echoing historical drawdowns from 2001 when shares fell 52%, and prior historical troughs that saw steeper losses of 66%. While recent quarterly metrics indicate revenue growth picking up to 30% and fiscal 2026 revenue climbing 17% to an annualized quarter run-rate with fiscal 2026 ending May 31, 2026, market participants continue to scrutinize the heavy capital requirements behind this expansion.
Recent debt issuance activity underscores these financing demands. On November 2, Oracle priced $10 billion of new notes carrying interest rates ranging from 7% to 8.65%, highlighting the rising cost of capital required to fund ongoing infrastructure scaling. Historically, following previous severe yearly declines, subsequent market performance diverged sharply depending on broader macroeconomic tech cycles—ranging from strong multi-digit rebounds in favorable liquidity environments to prolonged consolidation when sector demand softened.
## Impact on Broad Market Tickers
Broader market benchmarks reflect mixed cross-currents during the session. The S&P 500 gained approximately 8% through 2026, while individual megacap equities experienced varied institutional flows as sector participants navigate shifting cost-of-capital dynamics.
Read the full story
Original reporting and related coverage — attribution links only, not paid recommendations.
Trade this story
 Robinhood
 Webull
 Tradier
 IBKR
Chart this story
 TradingView
Broker and exchange buttons use invite / refer-a-friend links (rewards may be capped). Charting links (TradingView) are partner offers that may pay OppHub America a commission at no extra cost to you.
OppSHOP
Full OppSHOP →As an Amazon Associate, OppHub America earns from qualifying purchases. Shopping here helps keep the site free — at no extra cost to you. Disclosure

OppSHOP
Related to this story
Historical drawdowns in legacy enterprise software providers highlight t
Shop related →

Investing books
Read the classics
Shop this pick →

Personal finance books
Run the household books
Shop this pick →

Trading notebooks
Write the thesis first
Shop this pick →

Monitor for charts
See every pane
Shop this pick →
Based on reporting from yahoo-tickers-tape-movers.
Informational and educational only — not investment, financial, or legal advice. Disclosure
Shares a vertical MP4 loop to your phone's camera roll or app share sheet (Instagram, TikTok, Facebook Reels).