Barry, OppHub America Desk · · Source: yahoo-megacap-tickers
Pembina Pipeline $PBA Q2 Earnings Rise 5% on Higher Volumes
Watch Pembina Pipeline $PBA+WL for continued performance tracking against its reaffirmed 2026 adjusted EBITDA guidance.
Based on reporting from yahoo-megacap-tickers.
Pembina Pipeline's second-quarter adjusted EBITDA climbed 5% year-over-year to C$1.064 billion, driven by increased pipeline and facility volumes. Net earnings saw a significant 23% jump. The company reaffirmed its 2026 guidance, positioning itself toward the midpoint of its outlook.
Market context for this story
As of: After HoursLoading quotes…
Informational only — not investment advice. Full markets →
 Pembina Pipeline·$PBA
$PBAPembina Pipeline
TradingView
Live chart & market data via TradingView · OppHub classroom · Delayed or exchange real-time per TradingView data agreements · Not investment advice
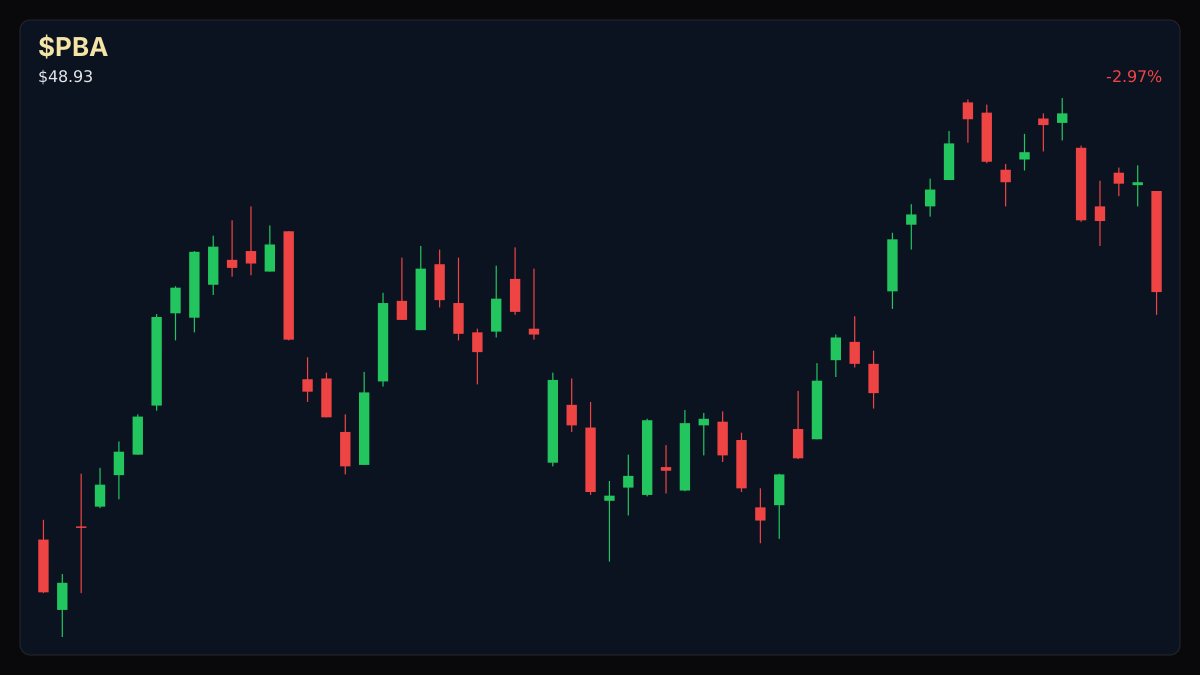
Educational TradingView chart — search any symbol in the widget. Confirm on /markets/PBA. Not investment advice.
Related markets
Shares a vertical MP4 loop to your phone's camera roll or app share sheet (Instagram, TikTok, Facebook Reels).
Pembina Pipeline $PBA+WL reported second-quarter adjusted EBITDA of C$1.064 billion, a 5% increase from the prior year. This performance was bolstered by a 3% rise in total volumes across its pipeline and facilities businesses, reaching 3.7 million barrels of oil equivalent per day. Net earnings increased 23% to C$512 million, with adjusted earnings up 10% to C$415 million. The company maintained its full-year 2026 adjusted EBITDA guidance range of C$4.35 billion to C$4.55 billion, indicating it is trending towards the midpoint of this forecast.
### Money Play
* Watch Pembina Pipeline $PBA+WL for continued performance tracking against its reaffirmed 2026 adjusted EBITDA guidance.
## Catalyst Analysis: Q2 Results Driven by Volume Growth and New Assets - Second-quarter adjusted EBITDA rose 5% year-over-year to C$1.064 billion. - Net earnings increased 23% to C$512 million. - Total volumes across pipelines and facilities grew 3% year-over-year. - Full-year 2026 adjusted EBITDA guidance reaffirmed at C$4.35 billion to C$4.55 billion.
## Impact on Pembina Pipeline ($PBA+WL)
### Winners, Losers & Uncertainty
### Risk Watch — legal/timeline; no fake EPS tables
The company's forward-looking guidance is a key metric for investors to monitor, with results expected to seasonally decline in the third quarter before improving in the fourth quarter. Pembina has hedged approximately 90% of its NGL fractionation-spread exposure for the third quarter and 40% for the fourth quarter.
Read the full story
Original reporting and related coverage — attribution links only, not paid recommendations.
Trade this story
 Robinhood
 Webull
 Tradier
 IBKR
IBKR
Chart this story
 TradingView
Broker and exchange buttons use invite / refer-a-friend links (rewards may be capped). Charting links (TradingView) are partner offers that may pay OppHub America a commission at no extra cost to you.
OppSHOP
Full OppSHOP →As an Amazon Associate, OppHub America earns from qualifying purchases. Shopping here helps keep the site free — at no extra cost to you. Disclosure

OppSHOP
Related to this story
Watch Pembina Pipeline $PBA for continued performance tracking against i
Shop related →

Investing books
Read the classics
Shop this pick →

Personal finance books
Run the household books
Shop this pick →

Trading notebooks
Write the thesis first
Shop this pick →

Monitor for charts
See every pane
Shop this pick →
Story playbook
A pre-built map of what to watch — stocks, ETFs, and educational next steps. Not personalized advice.
Snapshot date: July 31, 2026 at 8:11 PM ET
This playbook was built when the story published and is not live-updated. Prices, news, and risk can change after this date — treat it as a starting map, not a current trade ticket.
Story → money map
midstream energy infrastructure
Pembina Pipeline reported higher profits and increased pipeline usage compared to last year. Investors care because the company is on track to meet its long-term financial goals.
What changed
Pembina Pipeline reported a 5% increase in Q2 adjusted EBITDA and reaffirmed its 2026 guidance.
Who wins / who loses
Canadian midstream energy providers benefit from rising pipeline volumes, while regional producers face steady transportation costs.
Time horizon
Think in terms of the next few months.
Confidence & best fit
medium confidence · Long-term investor
Safer theme exposure (ETFs)
Baskets that own the theme without betting on one company.
Single stocks (higher risk)
Primary = closest to the story · Peers = same industry · Second-order = knock-on effects · Avoid = looks related but may be a trap
Primary
- $PBAWatch — track, don’t rush
The main company in the story is making more money because more oil and gas are flowing through its pipes.
View $PBA chart → · End-of-day delayed data
Peer
- $TRPWatch — track, don’t rush
Similar pipeline companies might see similar industry trends.
View $TRP chart → · End-of-day delayed data
- $ENBWatch — track, don’t rush
Another large pipeline operator that moves energy across North America.
View $ENB chart → · End-of-day delayed data
Options (education only)
No strikes or expiries — a framework for how traders might express the view. Options can expire worthless.
Direction: range · Style: Covered-call income (only if you already own shares) · Level: intermediate
Beginners should skip options and focus on holding the stock for dividends if desired.
Income / OppHub America angle
Not a trade tip — ways to use the insight outside the market.
- Monitor regional Canadian energy production metrics and throughput reports.
What would break this thesis
- Significant drop in pipeline volumes or a reduction in full-year guidance.
What to do next on OppHub America
Saved playbooks stay on this device for now.
Important
Not financial advice. OppHub America playbooks are educational market maps only — not recommendations to buy, sell, or hold any security. Markets move fast; information can be wrong or outdated. Trade and invest at your own risk. Do your own research or consult a licensed advisor.
Aftermath · $META
-6.26% vs write
- •Since this piece: $META is down -6.26% vs $593.87 at write time (now $556.71).
- •Session move (Yahoo delayed): +3.28%.
- •RSI14 at write was 44.7 — compare levels on Markets, not advice.
- •Original money play lens: Watch Pembina Pipeline $PBA for continued performance tracking against its reaffirmed 2026 adjusted EBITDA guidance.
- •Track $META live on OppHub Markets (/markets/META). Not financial advice.
Based on reporting from yahoo-megacap-tickers.
Informational and educational only — not investment, financial, or legal advice. Disclosure
Shares a vertical MP4 loop to your phone's camera roll or app share sheet (Instagram, TikTok, Facebook Reels).