Barry, OppHub America Desk · · Source: seeking-alpha
Reaccelerating CPI Prints 0.6% MoM: Inflation Pathways
Monitor fixed-income duration risk and rate-sensitive positioning as reaccelerating inflation figures influence Federal Reserve policy expectations.
Based on reporting from seeking-alpha.
Consumer prices reaccelerated with a 0.6% month-over-month seasonally adjusted increase, pushing the 12-month headline rate to 3.7%. This reacceleration complicates the Federal Reserve's rate path as traders reassess monetary tightening risks without an outright policy hike.
Market context for this story
As of: WeekendLoading quotes…
Informational only — not investment advice. Full markets →
 SPDR S&P 500 ETF·$SPY
 Invesco QQQ Trust·$QQQ
 iShares 20+ Year Treasury·$TLT
 Financial Select Sector·$XLF
$SPYSPDR S&P 500 ETF
TradingView
Live chart & market data via TradingView · OppHub classroom · Delayed or exchange real-time per TradingView data agreements · Not investment advice
$QQQInvesco QQQ Trust
TradingView
Live chart & market data via TradingView · OppHub classroom · Delayed or exchange real-time per TradingView data agreements · Not investment advice
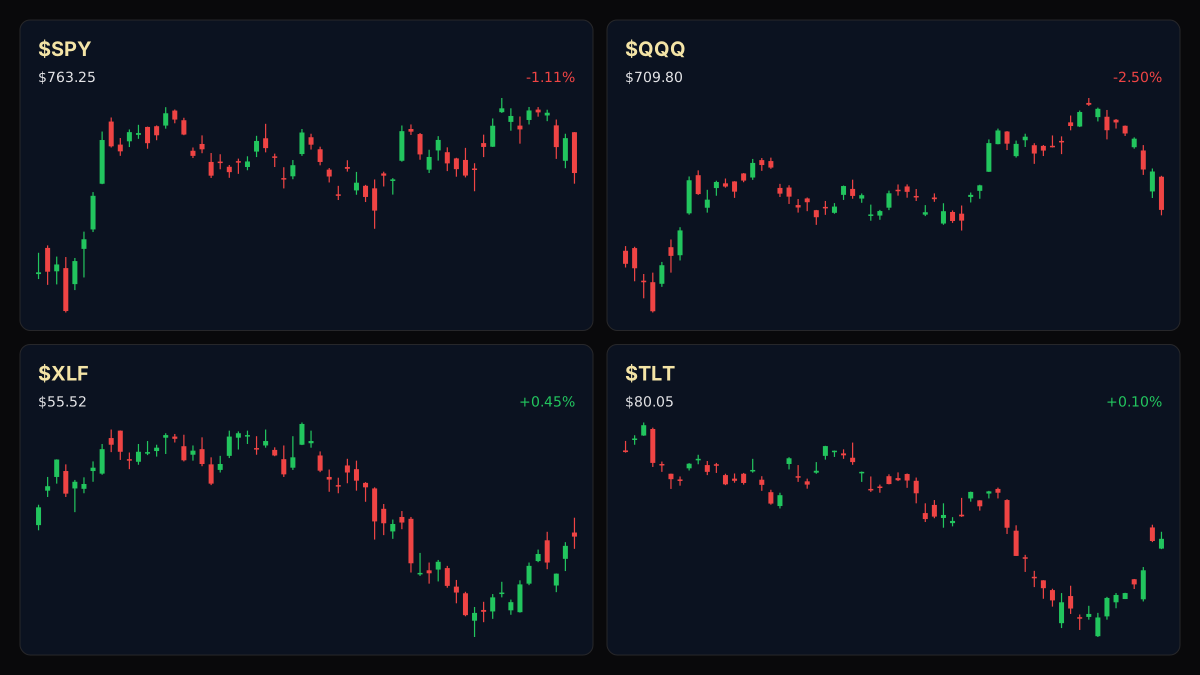
Educational TradingView charts — search any symbol in the widget. Confirm on /markets/SPY and related $QQQ, $TLT, $XLF. Not investment advice.
Related markets
Shares a vertical MP4 loop to your phone's camera roll or app share sheet (Instagram, TikTok, Facebook Reels).
Consumer prices reaccelerated as the Consumer Price Index for All Urban Consumers (CPI-U) increased 0.6% on a seasonally adjusted basis, bringing the 12-month headline inflation rate to 3.7%.
### Money Play As inflation prints reaccelerate, market participants continue to reprice duration risk and fixed-income positioning without requiring explicit central bank rate hikes.
### Executive Thesis The latest consumer price data confirms persistent upward pressure across the headline index, complicating the macroeconomic backdrop for capital allocators. With MoM inflation printing at 0.6% and the annualized rate registering at 3.7%, fixed-income markets face renewed scrutiny over the duration of restrictive monetary policy.
### The Print - **Month-over-Month:** CPI-U increased 0.6% on a seasonally adjusted basis. - **Year-over-Year:** The all items index increased 3.7% over the last 12 months. - **Directional Trend:** Consumer price changes reflect continued upward momentum rather than disinflationary cooling.
### Market Reaction Market participants are adjusting yield curve expectations in response to the firmer-than-expected headline print, weighing the implications for upcoming Federal Open Market Committee communications.
### What It Means for Policy & Positioning A reaccelerating CPI print challenges narratives of an effortless return to central bank target levels. Traders are recalibrating risk models to account for higher-for-longer policy stances, driving volatility across interest-rate-sensitive assets.
### Next Calendar Watch Participants are monitoring incoming employment and upcoming central bank releases for further confirmation of domestic economic resilience and price stability trends.
Read the full story
Original reporting and related coverage — attribution links only, not paid recommendations.
Trade this story
 Robinhood
 Webull
 Tradier
 IBKR
IBKR
Chart this story
 TradingView
Broker and exchange buttons use invite / refer-a-friend links (rewards may be capped). Charting links (TradingView) are partner offers that may pay OppHub America a commission at no extra cost to you.
OppSHOP
Full OppSHOP →As an Amazon Associate, OppHub America earns from qualifying purchases. Shopping here helps keep the site free — at no extra cost to you. Disclosure

OppSHOP
Related to this story
Monitor fixed-income duration risk and rate-sensitive positioning as rea
Shop related →

Investing books
Read the classics
Shop this pick →

Personal finance books
Run the household books
Shop this pick →

Trading notebooks
Write the thesis first
Shop this pick →

Monitor for charts
See every pane
Shop this pick →
Story playbook
A pre-built map of what to watch — stocks, ETFs, and educational next steps. Not personalized advice.
Snapshot date: October 17, 2026 at 10:06 AM ET
This playbook was built when the story published and is not live-updated. Prices, news, and risk can change after this date — treat it as a starting map, not a current trade ticket.
Story → money map
inflation and interest rate risk
Inflation came in hotter than expected last month, meaning the cost of living is still rising faster than the Federal Reserve wants. Investors care because higher inflation usually keeps interest rates elevated, which affects everything from bonds to stocks.
What changed
Monthly Consumer Price Index reaccelerated by 0.6%, bringing annual headline inflation to 3.7%.
Who wins / who loses
Short-duration fixed income and commodities benefit from persistent inflation, while long-duration bonds and rate-sensitive equities face pressure.
Time horizon
Think in terms of the next few weeks.
Confidence & best fit
high confidence · Long-term investor, Active trader
Safer theme exposure (ETFs)
Baskets that own the theme without betting on one company.
Single stocks (higher risk)
Primary = closest to the story · Peers = same industry · Second-order = knock-on effects · Avoid = looks related but may be a trap
Primary
- $IEFProtect — reduce risk
Government bonds usually lose value when inflation stays high because interest rates tend to stay up.
Peer
- $XLEBuild slowly — only if it fits your plan
Energy stocks often do well when prices are rising because oil and gas companies benefit from higher costs.
View $XLE chart → · End-of-day delayed data
Second-order
- $XLFWatch — track, don’t rush
Banks face mixed effects from high interest rates, making them important to watch closely.
View $XLF chart → · End-of-day delayed data
Options (education only)
No strikes or expiries — a framework for how traders might express the view. Options can expire worthless.
Direction: volatile · Style: Protective put / downside hedge idea · Level: intermediate
Think of this like buying insurance for your stock portfolio in case higher inflation causes the market to drop. Beginners should generally skip options and focus on cash or basic index funds.
Income / OppHub America angle
Not a trade tip — ways to use the insight outside the market.
- Review personal cash holdings to ensure emergency funds are earning competitive high-yield savings rates.
What would break this thesis
- Subsequent inflation prints showing a sharp return to cooling monthly trends or declining commodity prices.
What to do next on OppHub America
Saved playbooks stay on this device for now.
Important
Not financial advice. OppHub America playbooks are educational market maps only — not recommendations to buy, sell, or hold any security. Markets move fast; information can be wrong or outdated. Trade and invest at your own risk. Do your own research or consult a licensed advisor.
Based on reporting from seeking-alpha.
Informational and educational only — not investment, financial, or legal advice. Disclosure
Shares a vertical MP4 loop to your phone's camera roll or app share sheet (Instagram, TikTok, Facebook Reels).