Barry, OppHub America Desk · · Source: yahoo-tickers-tape-movers
Realty Income Dividend Durability Across Market Crashes
Income portfolios assessing real estate allocations should monitor occupancy metrics and yield spreads relative to broader index averages.
Based on reporting from yahoo-tickers-tape-movers.
Realty Income maintains a ~5.9% dividend yield backed by an occupancy rate near 99% and a history of hikes through every market crash since 1997. Investors evaluating defensive real estate vehicles examine how long-term lease stability withstands broader macroeconomic drawdowns.
Market context for this story
As of: After HoursLoading quotes…
Informational only — not investment advice. Full markets →


$SPYSPDR S&P 500 ETF
TradingView
Live chart & market data via TradingView · OppHub classroom · Delayed or exchange real-time per TradingView data agreements · Not investment advice
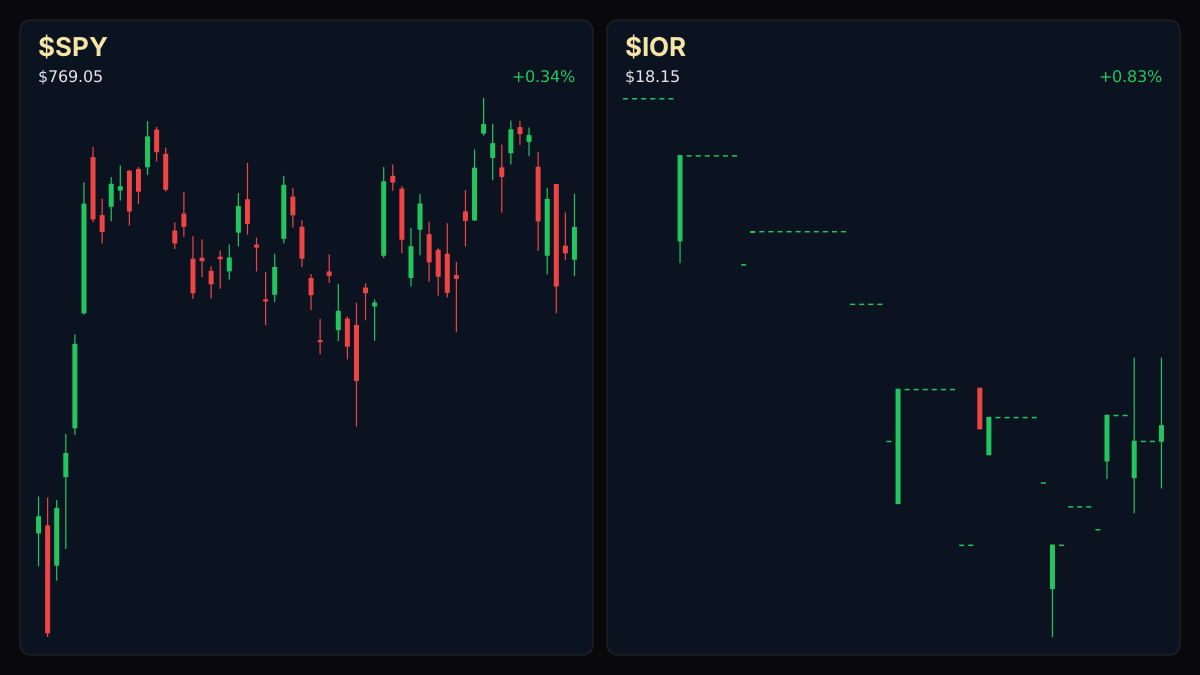
Educational TradingView chart — search any symbol in the widget. Confirm on /markets/SPY and related $IOR. Not investment advice.
Related markets
Shares a vertical MP4 loop to your phone's camera roll or app share sheet (Instagram, TikTok, Facebook Reels).
## Catalyst Analysis: Real Estate Yields and Historical Durability
Income-focused investors navigating equity volatility often look to real estate investment trusts with established operational histories. Realty Income, which went public in 1994, navigated major historical downturns—including the 1997 Asian financial crisis, the 2000 tech bust, and the 2008 financial crisis—while continuing to maintain its dividend distribution profile.
The company reports an occupancy rate of almost 99% across its single-tenant retail and commercial portfolio spanning the United States and eight European countries. At current valuations, the dividend yield sits around 5.9%, outpacing the S&P 500 average yield of 1.1%.
## Session Tape — Market Context
- S&P 500: 7,757.17 (+0.6%) - DJI: 52,856.09 (+0.7%) - NASDAQ: 26,702.86 (+1.1%) - Realty Income (O): 1.76% pullback in recent session context, trading within a 52-week range of $53.15 to $67.94.
## Impact on Income Portfolios
For market participants prioritizing yield stability over high-beta growth, high-occupancy REITs serve as a cash-flow anchor during choppy tape conditions. The divergence between broad market indices and real estate yields highlights the ongoing rotation toward defensive income streams.
Not financial advice. Market positioning and historical resilience do not guarantee future performance.
Read the full story
Original reporting and related coverage — attribution links only, not paid recommendations.
Trade this story
 Robinhood
 Webull
 Tradier
 IBKR
Chart this story
 TradingView
Broker and exchange buttons use invite / refer-a-friend links (rewards may be capped). Charting links (TradingView) are partner offers that may pay OppHub America a commission at no extra cost to you.
OppSHOP
Full OppSHOP →As an Amazon Associate, OppHub America earns from qualifying purchases. Shopping here helps keep the site free — at no extra cost to you. Disclosure

OppSHOP
Related to this story
Income portfolios assessing real estate allocations should monitor occup
Shop related →

Investing books
Read the classics
Shop this pick →

Personal finance books
Run the household books
Shop this pick →

Trading notebooks
Write the thesis first
Shop this pick →

Monitor for charts
See every pane
Shop this pick →
Story playbook
A pre-built map of what to watch — stocks, ETFs, and educational next steps. Not personalized advice.
Snapshot date: October 21, 2026 at 10:31 PM ET
This playbook was built when the story published and is not live-updated. Prices, news, and risk can change after this date — treat it as a starting map, not a current trade ticket.
Story → money map
defensive REIT dividend yield
A well-known real estate company is offering a steady 5.9% cash payout to investors even during tough economic times. Income investors care about this because it provides a reliable way to make money when the stock market is acting unpredictable.
What changed
Realty Income demonstrated historical dividend and occupancy resilience amid broader macroeconomic drawdowns, attracting income rotation.
Who wins / who loses
High-occupancy, net-lease REITs benefit from defensive income rotation, while high-beta growth stocks face capital outflows as investors chase yield.
Time horizon
Think in terms of the next few months.
Confidence & best fit
high confidence · Long-term investor, Side income / builder
Safer theme exposure (ETFs)
Baskets that own the theme without betting on one company.
Single stocks (higher risk)
Primary = closest to the story · Peers = same industry · Second-order = knock-on effects · Avoid = looks related but may be a trap
Peer
- $NNNBuild slowly — only if it fits your plan
A similar real-estate company that also relies on steady tenant rent to pay investors.
View $NNN chart → · End-of-day delayed data
- $WPCWatch — track, don’t rush
Another real-estate peer that owns different types of properties for rental income.
View $WPC chart → · End-of-day delayed data
Options (education only)
No strikes or expiries — a framework for how traders might express the view. Options can expire worthless.
Direction: range · Style: Covered-call income (only if you already own shares) · Level: intermediate
Beginners should skip options; just buy the stock for the dividend unless you want to make a small extra fee by agreeing to maybe sell your shares later.
Income / OppHub America angle
Not a trade tip — ways to use the insight outside the market.
- Review existing real estate allocation in personal portfolio against index yield averages.
What would break this thesis
- Significant drop in tenant occupancy rates below historical norms or rapid spikes in benchmark interest rates reducing relative yield attractiveness.
What to do next on OppHub America
Saved playbooks stay on this device for now.
Important
Not financial advice. OppHub America playbooks are educational market maps only — not recommendations to buy, sell, or hold any security. Markets move fast; information can be wrong or outdated. Trade and invest at your own risk. Do your own research or consult a licensed advisor.
Based on reporting from yahoo-tickers-tape-movers.
Informational and educational only — not investment, financial, or legal advice. Disclosure
Shares a vertical MP4 loop to your phone's camera roll or app share sheet (Instagram, TikTok, Facebook Reels).