Barry, OppHub America Desk · · Source: yahoo-tickers-rotation
Restaurant Stock Slumps: Chipotle and McDonald's Year-to-Date Dips
Housing & mortgages: Rate and housing policy spill into builders, small-caps, and REITs.
Based on reporting from yahoo-tickers-rotation.
Chipotle and McDonald's face steep year-to-date slumps as market volatility prompts a rotation toward defensive casual-dining alternatives. As of absolute calendar date Friday, October 2, 2026, sector evaluations highlight shifting momentum across major restaurant operators.
Market context for this story
As of: After HoursLoading quotes…
Informational only — not investment advice. Full markets →


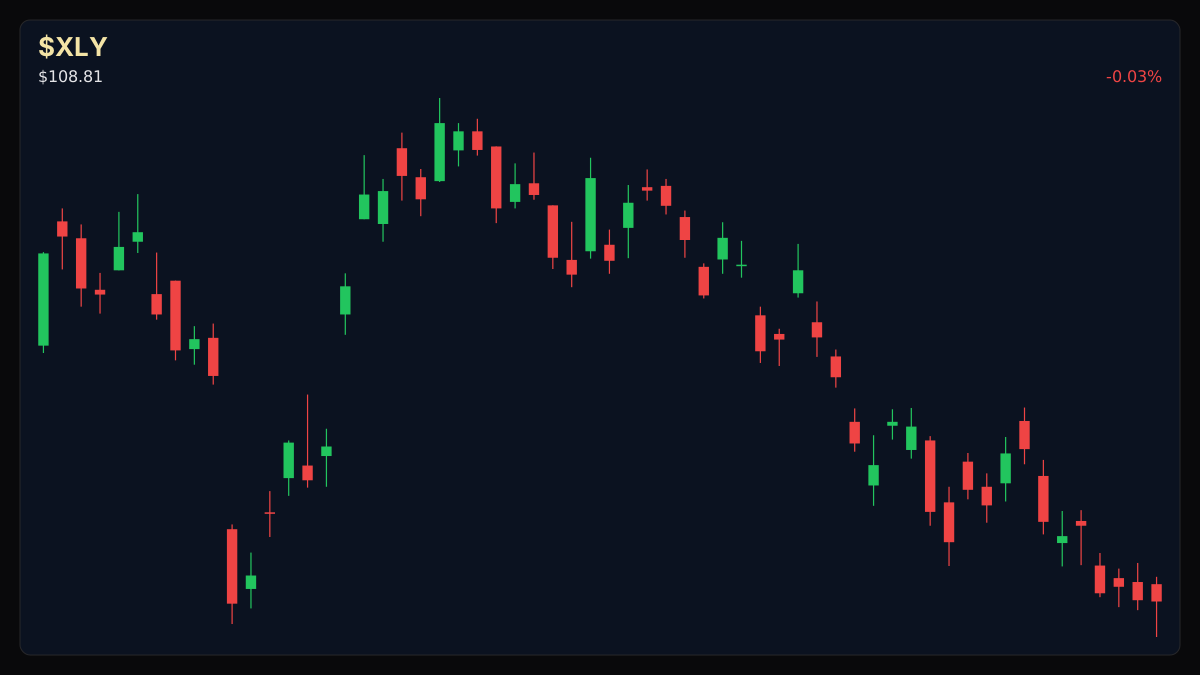
$XLYConsumer Discretionary
TradingView
Live chart & market data via TradingView · OppHub classroom · Delayed or exchange real-time per TradingView data agreements · Not investment advice
$QSP
TradingView
Live chart & market data via TradingView · OppHub classroom · Delayed or exchange real-time per TradingView data agreements · Not investment advice
Educational TradingView charts — search any symbol in the widget. Confirm on /markets/XLY and related $QSP, $CMG, $MCD. Not investment advice.
Related markets
Shares a vertical MP4 loop to your phone's camera roll or app share sheet (Instagram, TikTok, Facebook Reels).
### Session Tape — Premarket Movers - **Chipotle ($CMG+WL)**: +1.16% in verified session data. - **McDonald's ($MCD+WL)**: +0.39% in verified session data.
## Catalyst Analysis: Sector Dips and Casual-Dining Resilience Equity markets are monitoring broad restaurant sector performance as prominent operators experience notable drawdowns. Chipotle's stock declined roughly 14% year-to-date as of Tuesday, September 29, 2026, while McDonald's experienced a larger drop of approximately 24% over the same period. Despite these pullbacks, both enterprises maintain global scale and steady consumer traffic, drawing analytical focus toward operational resilience in fluctuating market environments.
## Technical Analysis & Key Risk Watch
Market participants tracking broader consumer discretionary equities note varying momentum across large-cap leaders. For instance, verified market context places major technology and growth vehicles at specific relative strength index levels—such as NVIDIA ($NVDA+WL) at an RSI of 56.3—reflecting underlying market breadth without attributing price movement to unverified corporate catalysts. Traders observe key support and resistance zones across major equities to gauge near-term directional bias during premarket positioning.
## Impact on Sector Peers Casual-dining alternatives such as Texas Roadhouse ($TXRH+WL)—which recently posted a daily change of +0.23% alongside a current price of $156.70 within a 52-week range of $153.82 to $216.30—illustrate how operational consistency influences investor sentiment when broader indexes experience volatility. Market participants continue to evaluate relative valuations across the restaurant aisle.
Read the full story
Original reporting and related coverage — attribution links only, not paid recommendations.
Trade this story
 Robinhood
 Webull
 Tradier
 IBKR
IBKR
Chart this story
 TradingView
Broker and exchange buttons use invite / refer-a-friend links (rewards may be capped). Charting links (TradingView) are partner offers that may pay OppHub America a commission at no extra cost to you.
OppSHOP
Full OppSHOP →As an Amazon Associate, OppHub America earns from qualifying purchases. Shopping here helps keep the site free — at no extra cost to you. Disclosure

OppSHOP
Related to this story
Housing & mortgages: Rate and housing policy spill into builders, small-
Shop related →

Investing books
Read the classics
Shop this pick →

Personal finance books
Run the household books
Shop this pick →

Trading notebooks
Write the thesis first
Shop this pick →

Monitor for charts
See every pane
Shop this pick →
Story playbook
A pre-built map of what to watch — stocks, ETFs, and educational next steps. Not personalized advice.
Snapshot date: October 2, 2026 at 4:56 AM ET
This playbook was built when the story published and is not live-updated. Prices, news, and risk can change after this date — treat it as a starting map, not a current trade ticket.
Story → money map
restaurant sector rotation
Big restaurant chains like Chipotle and McDonald's have seen their stock prices drop this year as investors look at other food options. People who watch the stock market use these shifts to figure out where consumers are spending their money.
What changed
Major restaurant operators experienced significant year-to-date declines while broader discretionary and tech equities showed mixed technical momentum.
Who wins / who loses
Casual-dining alternatives and defensive value plays benefit from rotation, while large-cap fast food leaders face relative momentum pressure.
Time horizon
Think in terms of the next few weeks.
Confidence & best fit
medium confidence · Long-term investor, Active trader
Safer theme exposure (ETFs)
Baskets that own the theme without betting on one company.
Single stocks (higher risk)
Primary = closest to the story · Peers = same industry · Second-order = knock-on effects · Avoid = looks related but may be a trap
Primary
- $CMGWatch — track, don’t rush
Chipotle stock is down quite a bit this year, so traders are watching to see when it might stabilize.
View $CMG chart → · End-of-day delayed data
- $MCDWatch — track, don’t rush
McDonald's has also seen a big price drop, making investors check if shoppers are pulling back on fast food.
View $MCD chart → · End-of-day delayed data
Second-order
- $NVDAWatch — track, don’t rush
NVIDIA is mentioned as a general market health check for big stocks, even though it makes chips instead of food.
View $NVDA chart → · End-of-day delayed data
Options (education only)
No strikes or expiries — a framework for how traders might express the view. Options can expire worthless.
Beginners should skip options here and stick to watching the stocks or using broad ETFs safely.
See options-friendly brokers →Income / OppHub America angle
Not a trade tip — ways to use the insight outside the market.
- Local restaurant franchise evaluation in Texas markets for foot-traffic trends.
What would break this thesis
- A rapid reversal in consumer spending data or unexpected earnings beats from major fast-food operators.
What to do next on OppHub America
Saved playbooks stay on this device for now.
Important
Not financial advice. OppHub America playbooks are educational market maps only — not recommendations to buy, sell, or hold any security. Markets move fast; information can be wrong or outdated. Trade and invest at your own risk. Do your own research or consult a licensed advisor.
Based on reporting from yahoo-tickers-rotation.
Informational and educational only — not investment, financial, or legal advice. Disclosure
Shares a vertical MP4 loop to your phone's camera roll or app share sheet (Instagram, TikTok, Facebook Reels).