Barry, OppHub America Desk · · Source: yahoo-tickers-tape-movers
Retail Trader Dominance Fuels Bond Volatility and IPO Shifts
Retail liquidity shifts and persistent bond market volatility require careful risk management as capital rotates into major tech names and upcoming public offerings.
Based on reporting from yahoo-tickers-tape-movers.
Inflation pressures and retail-driven positioning are dominating equity and fixed-income markets as investors navigate a volatile year-end tape. Following recent Consumer Price Index data showing a 0.4% monthly increase in CPI-U, market participants face heightened cross-asset swings with institutional defensive posture leaving retail flows in control.
Market context for this story
As of: After HoursLoading quotes…
Informational only — not investment advice. Full markets →
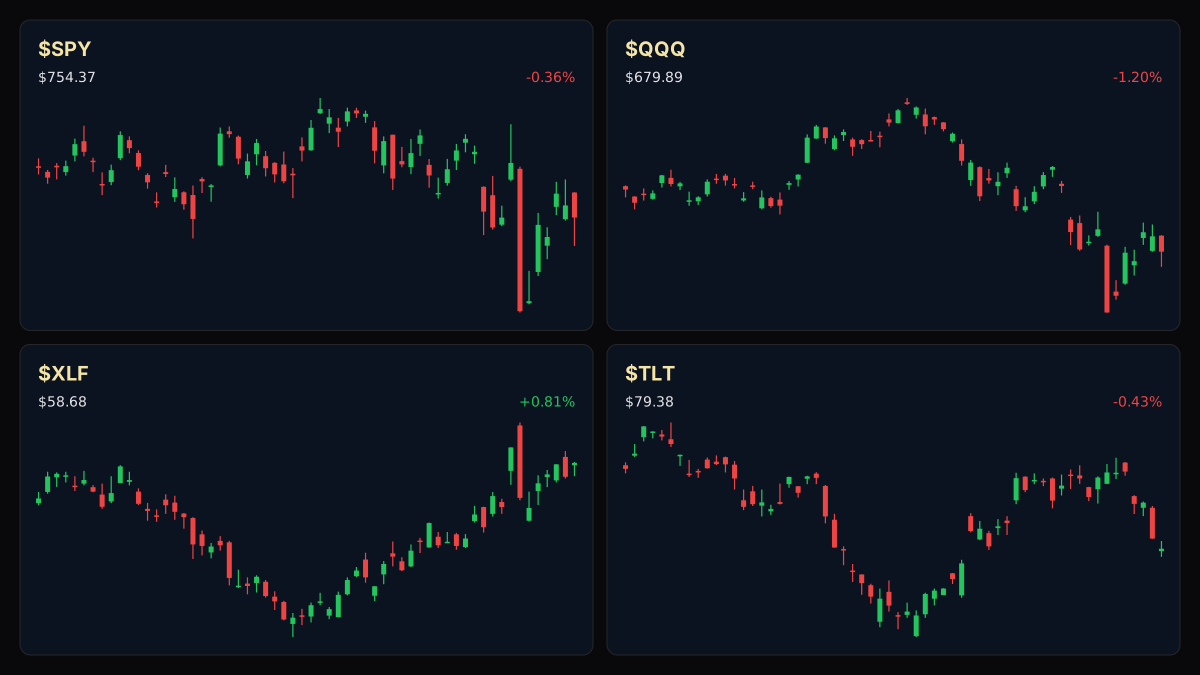
 SPDR S&P 500 ETF·$SPY
 Invesco QQQ Trust·$QQQ
 iShares 20+ Year Treasury·$TLT
 Financial Select Sector·$XLF
$SPYSPDR S&P 500 ETF
TradingView
Live chart & market data via TradingView · OppHub classroom · Delayed or exchange real-time per TradingView data agreements · Not investment advice
$QQQInvesco QQQ Trust
TradingView
Live chart & market data via TradingView · OppHub classroom · Delayed or exchange real-time per TradingView data agreements · Not investment advice
Educational TradingView charts — search any symbol in the widget. Confirm on /markets/SPY and related $QQQ, $TLT, $XLF. Not investment advice.
Related markets
Shares a vertical MP4 loop to your phone's camera roll or app share sheet (Instagram, TikTok, Facebook Reels).
Inflation readings and shifting retail liquidity continue to drive cross-asset swings, with the Consumer Price Index (CPI-U) increasing 0.4% on a seasonally adjusted basis, according to recent government data released amid ongoing bond market ructions.
### Money Play Market participants are navigating a retail-dominated tape into year-end as liquidity shifts toward upcoming public offerings and tech assets.
### Executive Thesis With hedge funds maintaining a defensive stance following a brutal October and November start, retail participants have assumed a primary role in directing market momentum. The combination of sticky inflation data—highlighted by a 0.4% MoM increase in CPI-U—and a lack of clear policy guidance from the Federal Reserve has left the fixed-income curve aggressively priced and highly sensitive to incoming economic prints.
### The Print Recent economic releases underscored persistent pricing pressures across the economy. Official figures show that the Consumer Price Index for All Urban Consumers (CPI-U) increased 0.4 percent on a seasonally adjusted basis.
### Market Reaction Bond markets remain under pressure as traders digest the implications of recent inflation data alongside shifting liquidity dynamics. Risk assets experience sector-specific strain as capital is drawn toward new public equity launches, contributing to choppy conditions across broader indexes.
### What It Means for Policy & Positioning Traders are treating the current environment as a position-driven, trader-focused market where institutional counterbalances are muted. Without decisive forward guidance from central bank officials, positioning relies heavily on incoming macro data releases and the timing of liquidity reallocations.
### Next Calendar Watch Market participants continue monitoring upcoming economic data releases and central bank communications for clearer indications on the interest rate path heading into the new year.
Read the full story
Original reporting and related coverage — attribution links only, not paid recommendations.
Trade this story
 Robinhood
 Webull
 Tradier
 IBKR
Chart this story
 TradingView
Broker and exchange buttons use invite / refer-a-friend links (rewards may be capped). Charting links (TradingView) are partner offers that may pay OppHub America a commission at no extra cost to you.
OppSHOP
Full OppSHOP →As an Amazon Associate, OppHub America earns from qualifying purchases. Shopping here helps keep the site free — at no extra cost to you. Disclosure

OppSHOP
Related to this story
Retail liquidity shifts and persistent bond market volatility require ca
Shop related →

Investing books
Read the classics
Shop this pick →

Personal finance books
Run the household books
Shop this pick →

Trading notebooks
Write the thesis first
Shop this pick →

Monitor for charts
See every pane
Shop this pick →
Story playbook
A pre-built map of what to watch — stocks, ETFs, and educational next steps. Not personalized advice.
Snapshot date: November 16, 2026 at 4:01 AM ET
This playbook was built when the story published and is not live-updated. Prices, news, and risk can change after this date — treat it as a starting map, not a current trade ticket.
Story → money map
retail liquidity and sticky inflation
Everyday individual investors are currently driving major stock and bond movements because big professional investors are playing it safe. Prices are still rising steadily, which makes the bond market nervous and creates choppy trading conditions.
What changed
Hotter-than-expected inflation data combined with retail-driven liquidity has amplified cross-asset volatility and bond market sensitivity.
Who wins / who loses
Retail-favored tech stocks and upcoming IPO pipelines benefit from active liquidity, while fixed-income assets and rate-sensitive sectors face continued pressure.
Time horizon
Think in terms of the next few weeks.
Confidence & best fit
medium confidence · Active trader
Safer theme exposure (ETFs)
Baskets that own the theme without betting on one company.
Single stocks (higher risk)
Primary = closest to the story · Peers = same industry · Second-order = knock-on effects · Avoid = looks related but may be a trap
Primary
- $QQQWatch — track, don’t rush
Tracks big technology companies that regular investors are currently focusing on.
View $QQQ chart → · End-of-day delayed data
Second-order
- $TLTProtect — reduce risk
Tracks long-term government bonds, which are struggling as inflation stays persistent.
View $TLT chart → · End-of-day delayed data
Options (education only)
No strikes or expiries — a framework for how traders might express the view. Options can expire worthless.
Options are expensive right now because the market is nervous and unpredictable. Beginners should skip options until the market settles down.
See options-friendly brokers →Income / OppHub America angle
Not a trade tip — ways to use the insight outside the market.
- Review cash yields while short-term rates remain elevated to optimize idle capital.
What would break this thesis
- A significant cooling in upcoming inflation data or a sharp return of institutional risk appetite.
What to do next on OppHub America
Saved playbooks stay on this device for now.
Important
Not financial advice. OppHub America playbooks are educational market maps only — not recommendations to buy, sell, or hold any security. Markets move fast; information can be wrong or outdated. Trade and invest at your own risk. Do your own research or consult a licensed advisor.
Based on reporting from yahoo-tickers-tape-movers.
Informational and educational only — not investment, financial, or legal advice. Disclosure
Shares a vertical MP4 loop to your phone's camera roll or app share sheet (Instagram, TikTok, Facebook Reels).