Barry, OppHub America Desk · · Source: yahoo-tickers-tape-movers
Robinhood Assets Trail Interactive Brokers: Account Balances
If reviewing online brokerage asset growth, watch because account size scaling directly influences interest income and trading volume durability across retail platforms.
Based on reporting from yahoo-tickers-tape-movers.
Robinhood Markets operates with significantly more funded customers than Interactive Brokers, yet total client equity remains far lower per account. Understanding this structural gap highlights how different platform demographics dictate average deposit scales and revenue generation across retail trading vehicles.
Market context for this story
As of: PremarketLoading quotes…
Informational only — not investment advice. Full markets →


$HOODRobinhood Markets
TradingView
Live chart & market data via TradingView · OppHub classroom · Delayed or exchange real-time per TradingView data agreements · Not investment advice
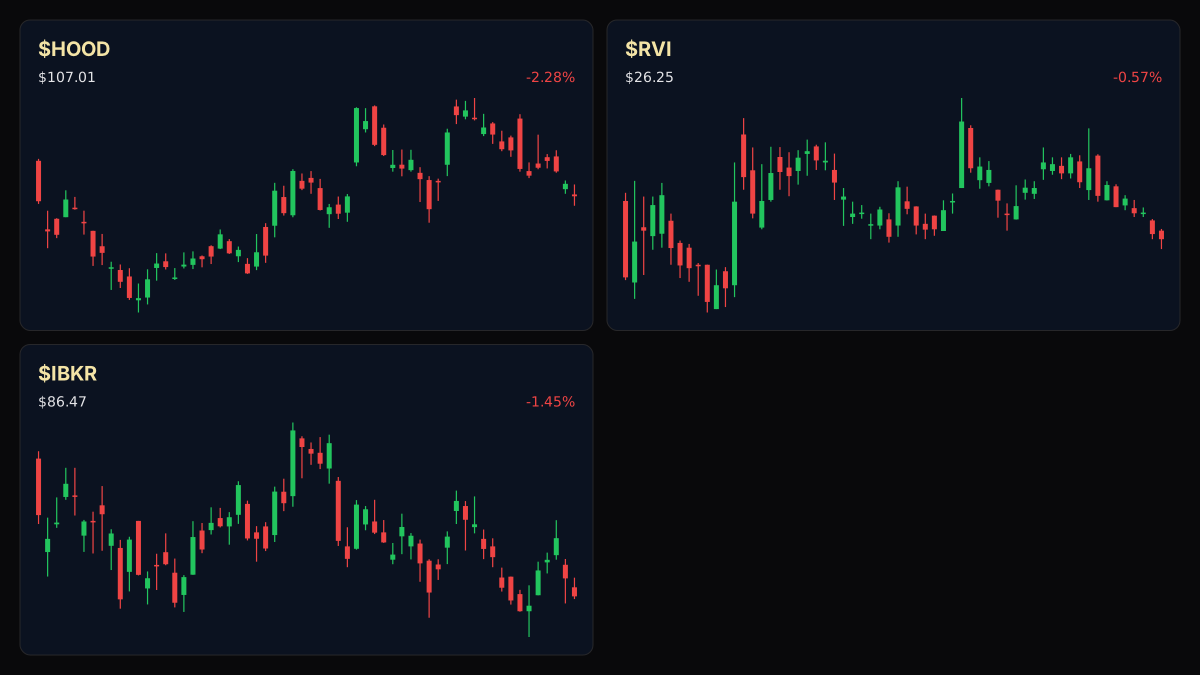
Educational TradingView chart — search any symbol in the widget. Confirm on /markets/HOOD and related $RVI, $IBKR. Not investment advice.
Related markets
Shares a vertical MP4 loop to your phone's camera roll or app share sheet (Instagram, TikTok, Facebook Reels).
Robinhood Markets ($HOOD+WL) reports millions of funded customers alongside platform assets averaging thousands per user, contrasting sharply with larger institutional-grade peer metrics.
### Session Tape - $HOOD+WL: Active online brokerage platform monitoring user deposit growth and asset retention.
## Catalyst Analysis: Platform Demographics and Account Balances
Comparative data highlights distinct operational scales between online brokers. Interactive Brokers closed September with approximately $965 billion of client equity distributed across roughly 5.6 million accounts, translating to about $173,000 per account. Conversely, Robinhood Markets closed August with $384 billion in platform assets across 28.6 million funded customers, averaging approximately $13,400 per account.
While Robinhood maintains roughly five times the customer headcount of Interactive Brokers, the latter holds approximately 2.5 times the total client equity. This disparity illustrates how target client bases shape platform asset concentration and long-term monetization paths.
### Money Play - If reviewing online brokerage asset growth, watch $HOOD+WL because account size scaling directly influences interest income and trading volume durability across retail platforms.
Read the full story
Original reporting and related coverage — attribution links only, not paid recommendations.
Trade this story
 Robinhood
 Webull
 Tradier
 IBKR
IBKR
Chart this story
 TradingView
Broker and exchange buttons use invite / refer-a-friend links (rewards may be capped). Charting links (TradingView) are partner offers that may pay OppHub America a commission at no extra cost to you.
OppSHOP
Full OppSHOP →As an Amazon Associate, OppHub America earns from qualifying purchases. Shopping here helps keep the site free — at no extra cost to you. Disclosure

OppSHOP
Related to this story
If reviewing online brokerage asset growth, watch because account size s
Shop related →

Investing books
Read the classics
Shop this pick →

Personal finance books
Run the household books
Shop this pick →

Trading notebooks
Write the thesis first
Shop this pick →

Monitor for charts
See every pane
Shop this pick →
Story playbook
A pre-built map of what to watch — stocks, ETFs, and educational next steps. Not personalized advice.
Snapshot date: October 9, 2026 at 4:32 AM ET
This playbook was built when the story published and is not live-updated. Prices, news, and risk can change after this date — treat it as a starting map, not a current trade ticket.
Story → money map
Online Brokerage Demographics
Interactive Brokers has fewer customers than Robinhood, but its users keep much larger account balances on average. Money managers watch these numbers because bigger accounts mean steadier earnings from interest and trading.
What changed
Comparative asset data reveals that Interactive Brokers maintains $965 billion across 5.6 million accounts compared to Robinhood's $384 billion across 28.6 million funded customers.
Who wins / who loses
Institutional-grade retail brokers with wealthier client bases benefit relative to mass-market apps reliant on smaller retail deposits.
Time horizon
Think in terms of the next few months.
Confidence & best fit
medium confidence · Long-term investor, Active trader
Safer theme exposure (ETFs)
Baskets that own the theme without betting on one company.
Single stocks (higher risk)
Primary = closest to the story · Peers = same industry · Second-order = knock-on effects · Avoid = looks related but may be a trap
Primary
- $HOODWatch — track, don’t rush
Robinhood has many users, but smaller average account sizes make earnings more sensitive to retail trading trends.
View $HOOD chart → · End-of-day delayed data
Peer
- $IBKRWatch — track, don’t rush
Interactive Brokers serves wealthier clients who hold larger balances, supporting steady revenue.
View $IBKR chart → · End-of-day delayed data
Second-order
- $SCHWWatch — track, don’t rush
Large traditional brokerages also fight for these same customer deposits and cash yields.
View $SCHW chart → · End-of-day delayed data
Options (education only)
No strikes or expiries — a framework for how traders might express the view. Options can expire worthless.
Beginners should skip options here and focus on understanding how user deposit sizes affect brokerage earnings over time.
See options-friendly brokers →Income / OppHub America angle
Not a trade tip — ways to use the insight outside the market.
- Monitor cash sweep yield offerings across competing fintech platforms to see where retail deposits migrate.
What would break this thesis
- Rapid shifts in retail deposit inflows or sudden changes in interest rate environments that compress net interest margins.
What to do next on OppHub America
Saved playbooks stay on this device for now.
Important
Not financial advice. OppHub America playbooks are educational market maps only — not recommendations to buy, sell, or hold any security. Markets move fast; information can be wrong or outdated. Trade and invest at your own risk. Do your own research or consult a licensed advisor.
Based on reporting from yahoo-tickers-tape-movers.
Informational and educational only — not investment, financial, or legal advice. Disclosure
Shares a vertical MP4 loop to your phone's camera roll or app share sheet (Instagram, TikTok, Facebook Reels).