Barry, OppHub America Desk · · Source: yahoo-tickers-tape-movers
Rocket Lab Historical Volatility: Examining Past Drawdowns
Market participants evaluating high-volatility equities must weigh historical drawdown recovery timelines against prevailing sector sentiment. Not financial advice.
Based on reporting from yahoo-tickers-tape-movers.
As of Wednesday, November 4, 2026, market data highlights historical drawdowns in Rocket Lab, examining prior periods when the space equity shed significant value before recovery. Investors tracking tape movement and valuation drawdowns look at historical percentage declines to contextualize current trading ranges relative to past milestones.
Market context for this story
As of: PremarketLoading quotes…
Informational only — not investment advice. Full markets →


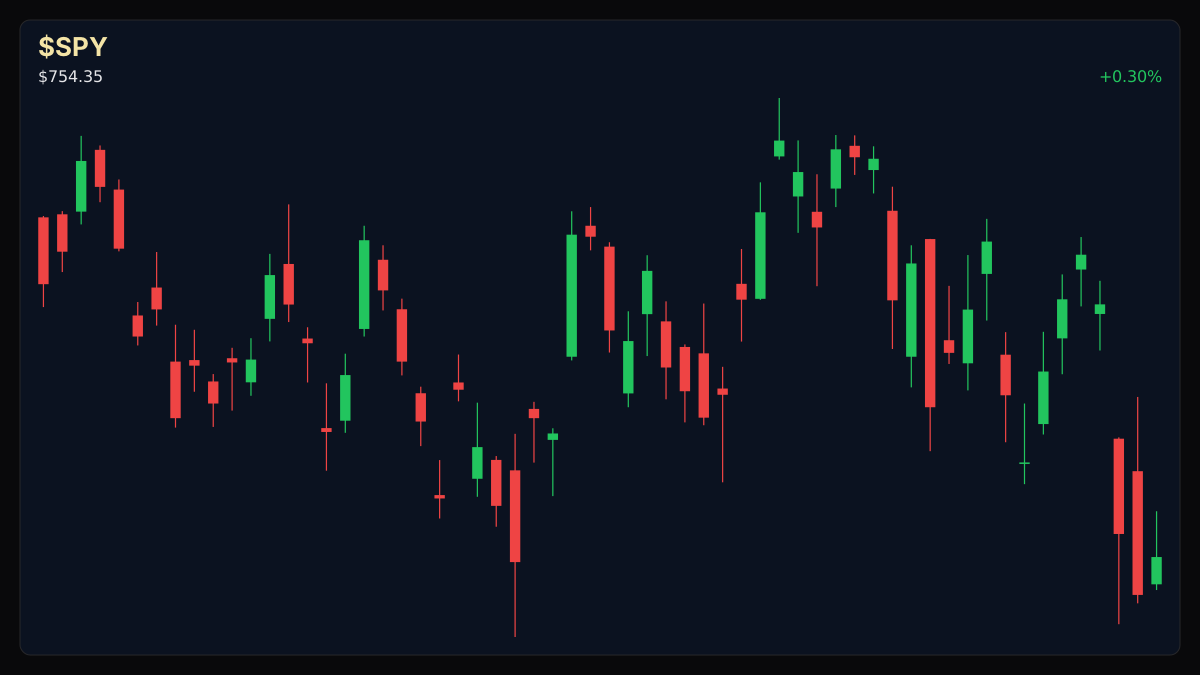
$SPYSPDR S&P 500 ETF
TradingView
Live chart & market data via TradingView · OppHub classroom · Delayed or exchange real-time per TradingView data agreements · Not investment advice
$AAPL
TradingView
Live chart & market data via TradingView · OppHub classroom · Delayed or exchange real-time per TradingView data agreements · Not investment advice
Educational TradingView charts — search any symbol in the widget. Confirm on /markets/SPY and related $AAPL, $AMZN, $GOOG. Not investment advice.
Related markets
Shares a vertical MP4 loop to your phone's camera roll or app share sheet (Instagram, TikTok, Facebook Reels).
## Catalyst Analysis: Historical Volatility and Drawdown Context
Market analysis of Rocket Lab highlights historical volatility patterns, referencing prior periods where the equity experienced sharp drawdowns exceeding 80% before mounting recoveries. Historical tape data shows that previous troughs, such as a closing print of $3.53 on April 15, 2024, preceded subsequent phases of revenue growth and backlog expansion. Observers reviewing past performance note that historical cyclicality in high-growth sectors often involves steep price corrections alongside underlying business expansion.
## Session Tape — Broad Market Overview
Broader index and equity movement during the session reflected mixed sentiment across asset classes on Wednesday, November 4, 2026. The S&P 500 moved +0.4% to 7,568.92, while the Dow Jones Industrial Average fell 0.4% to 51,786.72. The Nasdaq Composite advanced +0.8% to 25,372.01, and Bitcoin traded at $78,331.00, up +2.1%. Among individual equities tracked in market data, $AAPL+WL traded down -1.9% at $331.90, $AMZN+WL rose +2.1% to $250.69, $GOOG+WL gained +0.1% to $278.27, $META+WL advanced +2.4% to $621.03, $MSFT+WL climbed +2.7% to $520.99, $NVDA+WL rose +2.3% to $206.69, and $TSLA+WL declined -1.3% to $398.50.
## Impact on Sector Sentiment
Growth and technology segments continue to experience elevated sensitivity to shifting risk appetite. Historical analogs in niche industries like aerospace manufacturing demonstrate that valuation multiples can contract sharply during broader sector consolidation, regardless of underlying contract backlogs or operational delivery milestones.
Read the full story
Original reporting and related coverage — attribution links only, not paid recommendations.
Trade this story
 Robinhood
 Webull
 Tradier
 IBKR
Chart this story
 TradingView
Broker and exchange buttons use invite / refer-a-friend links (rewards may be capped). Charting links (TradingView) are partner offers that may pay OppHub America a commission at no extra cost to you.
OppSHOP
Full OppSHOP →As an Amazon Associate, OppHub America earns from qualifying purchases. Shopping here helps keep the site free — at no extra cost to you. Disclosure

OppSHOP
Related to this story
Market participants evaluating high-volatility equities must weigh histo
Shop related →

Investing books
Read the classics
Shop this pick →

Personal finance books
Run the household books
Shop this pick →

Trading notebooks
Write the thesis first
Shop this pick →

Monitor for charts
See every pane
Shop this pick →
Story playbook
A pre-built map of what to watch — stocks, ETFs, and educational next steps. Not personalized advice.
Snapshot date: November 4, 2026 at 4:26 AM ET
This playbook was built when the story published and is not live-updated. Prices, news, and risk can change after this date — treat it as a starting map, not a current trade ticket.
Story → money map
aerospace volatility
Rocket Lab's stock has a history of big price drops followed by strong recoveries as the business grows. Investors look at these past patterns to figure out if current price dips are normal bumps on the road or something to worry about.
What changed
Market analysis of Rocket Lab's historical drawdowns and volatility patterns provides context for current valuation ranges relative to past troughs.
Who wins / who loses
Long-term believers in aerospace growth benefit from historical perspective, while impatient traders risk getting shaken out by high volatility.
Time horizon
Think in terms of the next few weeks.
Confidence & best fit
medium confidence · Active trader, Long-term investor
Safer theme exposure (ETFs)
Baskets that own the theme without betting on one company.
Single stocks (higher risk)
Primary = closest to the story · Peers = same industry · Second-order = knock-on effects · Avoid = looks related but may be a trap
Primary
- $RKLBWatch — track, don’t rush
The company's stock moves up and down a lot, so watchers look at past price drops to see how it might recover.
View $RKLB chart → · End-of-day delayed data
Peer
- $SPCEWatch — track, don’t rush
Other space stocks tend to move in the same direction when investors change how much risk they want to take.
View $SPCE chart → · End-of-day delayed data
Options (education only)
No strikes or expiries — a framework for how traders might express the view. Options can expire worthless.
Options are expensive when a stock bounces around a lot; beginners should skip them entirely here.
See options-friendly brokers →Income / OppHub America angle
Not a trade tip — ways to use the insight outside the market.
- Monitor broader high-growth tech and space sector sentiment indices.
What would break this thesis
- Substantial deterioration in underlying revenue growth or aerospace backlog expansion.
What to do next on OppHub America
Saved playbooks stay on this device for now.
Important
Not financial advice. OppHub America playbooks are educational market maps only — not recommendations to buy, sell, or hold any security. Markets move fast; information can be wrong or outdated. Trade and invest at your own risk. Do your own research or consult a licensed advisor.
Based on reporting from yahoo-tickers-tape-movers.
Informational and educational only — not investment, financial, or legal advice. Disclosure
Shares a vertical MP4 loop to your phone's camera roll or app share sheet (Instagram, TikTok, Facebook Reels).