Barry, OppHub America Desk · · Source: yahoo-tickers-tape-movers
Salesforce: Profitability Gains Clouded by Rising Debt Load
- If Salesforce's free cash flow growth underperforms guided levels, especially as it integrates new acquisitions, investors may re-evaluate the stock's risk profile. - Watch as its current valuation reflects a blend of improved cash generation and increased financial leverage.
Based on reporting from yahoo-tickers-tape-movers.
Salesforce's recent surge in profitability is tempered by a significant increase in debt financing, raising questions about the stock's risk profile. While free cash flow has improved, investors are watching to see if subscriber revenue growth can outpace debt service. This dynamic presents a complex picture for CRM.
Market context for this story
As of: Regular HoursLoading quotes…
Informational only — not investment advice. Full markets →
 Salesforce·$CRM
$CRMSalesforce
TradingView
Live chart & market data via TradingView · OppHub classroom · Delayed or exchange real-time per TradingView data agreements · Not investment advice
Educational TradingView chart — search any symbol in the widget. Confirm on /markets/CRM. Not investment advice.
Related markets
Shares a vertical MP4 loop to your phone's camera roll or app share sheet (Instagram, TikTok, Facebook Reels).
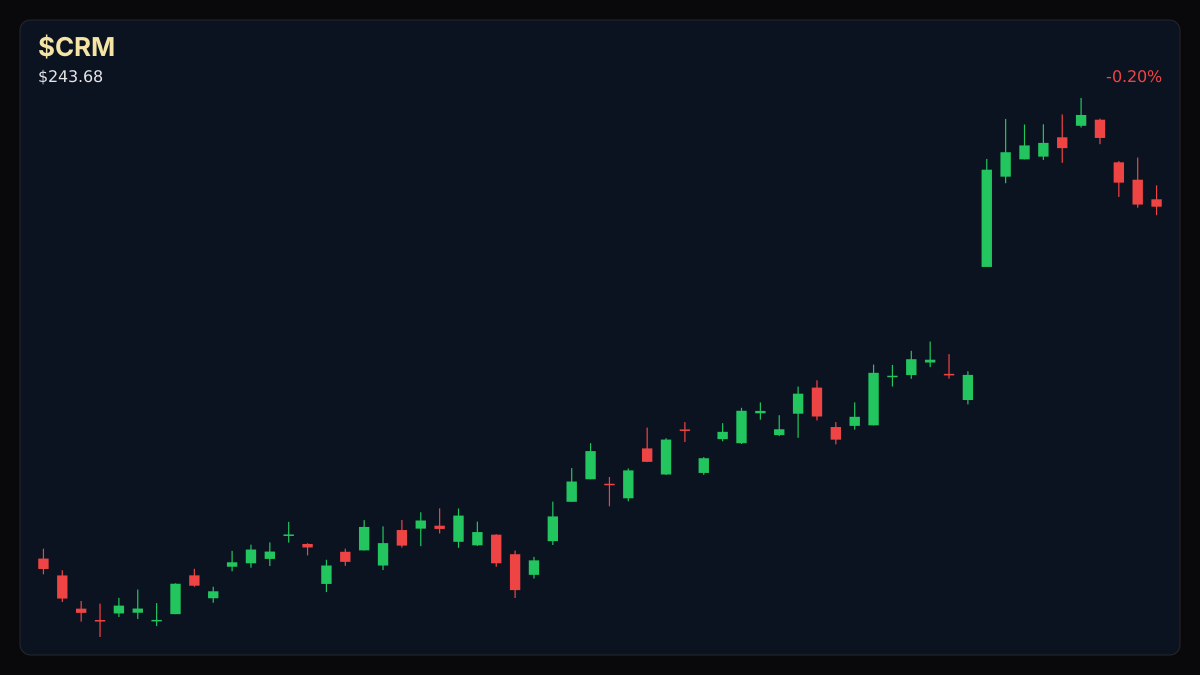
Salesforce's stock has traded flat over the past year, underperforming the broader market. However, the company's operational landscape has shifted, with a notable increase in debt financing contributing to 38.1% of its assets, a substantial rise from its 14-year average of 14.8%. This strategic financing is funding a $25 billion accelerated share repurchase program, expected to retire at least 14% of outstanding shares.
Financially, Salesforce demonstrates improved profitability, with operating margins reaching 21.5% compared to a 14-year average of 2.2%. Free cash flow now represents 34.5% of revenue, up from a historical average of 20.2%. This enhanced cash generation may enable the company to manage its increased debt load more comfortably.
Despite these improvements, a key risk to monitor is the pace of cash growth relative to revenue. Salesforce projects fiscal 2027 subscription and support revenue to grow over 12% year-over-year, with operating and free cash flow increasing around 4% to 5%. The divergence between subscription revenue growth and cash flow growth servicing debt warrants attention, particularly as the company integrates recent acquisitions like Informatica, Contentful, and Fin.
### Story Arc / How We Got Here Enterprise AI software stocks, including Palantir Technologies and ServiceNow, saw surges previously on market momentum and strategic alliances. Today's focus on Salesforce's financial structure highlights how increased profitability can be intertwined with rising debt, prompting a closer look at the risk-return profile of established tech players. Prior coverage can be found here: /explore/palantir-rallies-on-pwc-alliance-amid-burry-bear-case-servicenow-climbs.
Read the full story
Original reporting and related coverage — attribution links only, not paid recommendations.
Trade this story
 Robinhood
 Webull
 Tradier
 IBKR
IBKR
Chart this story
 TradingView
Broker and exchange buttons use invite / refer-a-friend links (rewards may be capped). Charting links (TradingView) are partner offers that may pay OppHub America a commission at no extra cost to you.
OppSHOP
Full OppSHOP →As an Amazon Associate, OppHub America earns from qualifying purchases. Shopping here helps keep the site free — at no extra cost to you. Disclosure

OppSHOP
Related to this story
- If Salesforce's free cash flow growth underperforms guided levels, esp
Shop related →

Investing books
Read the classics
Shop this pick →

Personal finance books
Run the household books
Shop this pick →

Trading notebooks
Write the thesis first
Shop this pick →

Monitor for charts
See every pane
Shop this pick →
Story playbook
A pre-built map of what to watch — stocks, ETFs, and educational next steps. Not personalized advice.
Snapshot date: September 10, 2026 at 2:56 PM ET
This playbook was built when the story published and is not live-updated. Prices, news, and risk can change after this date — treat it as a starting map, not a current trade ticket.
Story → money map
enterprise software leverage
Salesforce is making more profit and buying back its own stock, but it has also borrowed a lot of money to do so. People are watching to see if the company makes enough steady cash to easily pay off those new debts.
What changed
Salesforce significantly increased its debt load to fund a massive share repurchase program while boosting operating margins and free cash flow.
Who wins / who loses
Shareholders benefit from reduced share counts and higher profitability, while risk-averse investors may lose out if debt servicing becomes burdensome.
Time horizon
Think in terms of the next few months.
Confidence & best fit
medium confidence · Long-term investor, Active trader
Safer theme exposure (ETFs)
Baskets that own the theme without betting on one company.
Single stocks (higher risk)
Primary = closest to the story · Peers = same industry · Second-order = knock-on effects · Avoid = looks related but may be a trap
Primary
- $CRMWatch — track, don’t rush
Salesforce is the main company in this story, trying to balance big profits and new debt.
View $CRM chart → · End-of-day delayed data
Peer
- $NOWWatch — track, don’t rush
ServiceNow is a competitor in the same business software space.
View $NOW chart → · End-of-day delayed data
- $PLTRWatch — track, don’t rush
Palantir is another big player in enterprise software that investors compare Salesforce against.
View $PLTR chart → · End-of-day delayed data
Options (education only)
No strikes or expiries — a framework for how traders might express the view. Options can expire worthless.
Beginners should skip options here and stick to watching the stock or using broad funds, as the debt versus profit story is still playing out.
See options-friendly brokers →Income / OppHub America angle
Not a trade tip — ways to use the insight outside the market.
- Monitor enterprise IT budgets and software spending reports.
What would break this thesis
- Free cash flow growth significantly outstrips debt servicing costs or subscription revenue accelerates beyond 12%.
What to do next on OppHub America
Saved playbooks stay on this device for now.
Important
Not financial advice. OppHub America playbooks are educational market maps only — not recommendations to buy, sell, or hold any security. Markets move fast; information can be wrong or outdated. Trade and invest at your own risk. Do your own research or consult a licensed advisor.
Based on reporting from yahoo-tickers-tape-movers.
Informational and educational only — not investment, financial, or legal advice. Disclosure
Shares a vertical MP4 loop to your phone's camera roll or app share sheet (Instagram, TikTok, Facebook Reels).