OppHub America Desk · · Source: yahoo-tickers-tape-movers
SCHD Dividend ETF Yield and Capital Outlay Analysis
Income and total-return positioning requires evaluating asset allocation relative to broader market volatility and cash flow objectives. Investors examining dividend vehicles should review total expense ratios and historical distribution continuity rather than relying solely on trailing yields.
Based on reporting from yahoo-tickers-tape-movers.
Generating $1,000 in monthly dividend income requires examining capital requirements and portfolio yields. The Schwab U.S. Dividend Equity ETF features a dividend yield of approximately 2.95% to 3.1%, alongside an expense ratio of 0.06% and assets under management totaling $121.09 billion.
Market context for this story
As of: WeekendLoading quotes…
Informational only — not investment advice. Full markets →


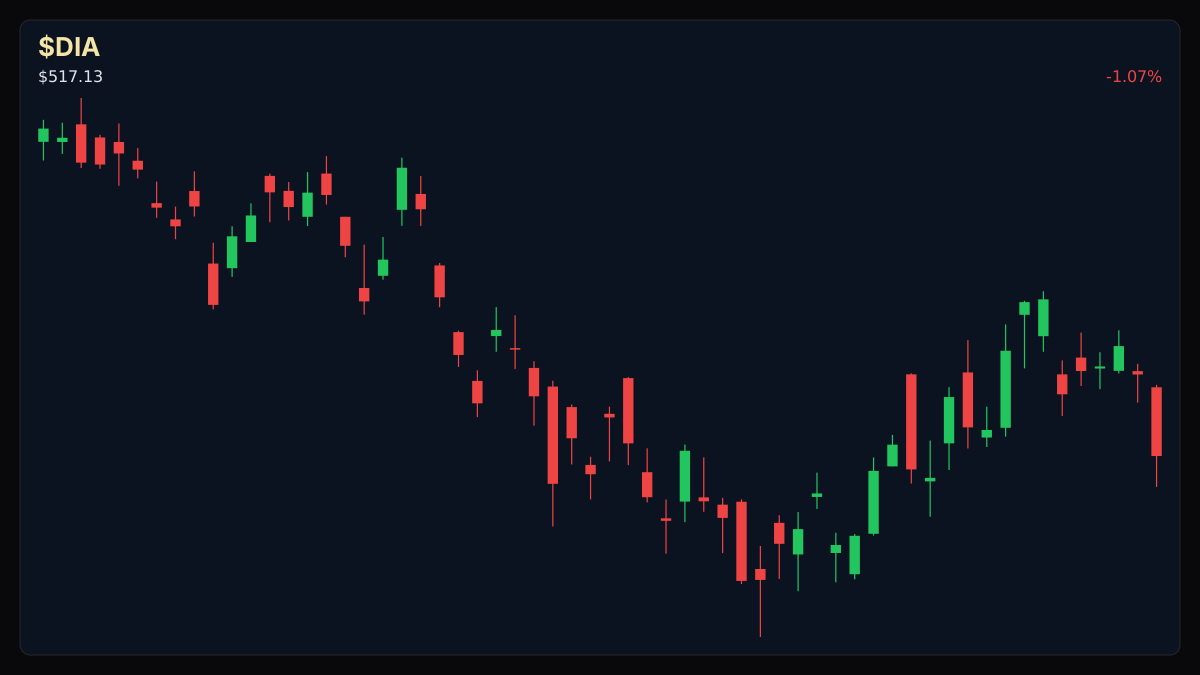
$DIASPDR Dow Jones ETF
TradingView
Live chart & market data via TradingView · OppHub classroom · Delayed or exchange real-time per TradingView data agreements · Not investment advice
Educational TradingView chart — search any symbol in the widget. Confirm on /markets/DIA and related $CVX, $TXN. Not investment advice.
Related markets
Shares a vertical MP4 loop to your phone's camera roll or app share sheet (Instagram, TikTok, Facebook Reels).
### Session Tape — Schwab U.S. Dividend Equity ETF
## Catalyst Analysis: Dividend Yield and Capital Requirements
Income investors evaluating equity-based payout strategies must calculate the capital outlay needed to achieve specific cash flow targets. Based on current figures, the Schwab U.S. Dividend Equity ETF maintains a dividend yield hovering around 2.95% to 3.1%. Because distributions occur quarterly, reaching an annual income goal of $12,000—equivalent to $1,000 per month—demands a substantial capital investment of approximately $387,000, given the fund's current yield parameters.
The underlying portfolio construction focuses on durable, high-quality domestic corporations that have maintained consecutive dividend payments for a minimum of 10 years, tracking the Dow Jones U.S. Dividend 100 Index. Key holdings include major energy and industrial names, such as ConocoPhillips (COP) at 4.26%, Chevron (CVX) at 4.27%, and Texas Instruments (TXN) at 4.80%, combined with an expense ratio of 0.06%.
### Money Play
Income and total-return positioning requires evaluating asset allocation relative to broader market volatility and cash flow objectives. Investors examining dividend vehicles should review total expense ratios and historical distribution continuity rather than relying solely on trailing yields.
## Impact on Related Holdings
Income-focused strategies often intersect with broader equity market fluctuations, where shifts in large-cap energy and technology holdings influence overall portfolio stability during weekend consolidation phases.
Read the full story
Original reporting and related coverage — attribution links only, not paid recommendations.
Trade this story
 Robinhood
 Webull
 Tradier
 IBKR
Chart this story
 TradingView
Broker and exchange buttons use invite / refer-a-friend links (rewards may be capped). Charting links (TradingView) are partner offers that may pay OppHub America a commission at no extra cost to you.
OppSHOP
Full OppSHOP →As an Amazon Associate, OppHub America earns from qualifying purchases. Shopping here helps keep the site free — at no extra cost to you. Disclosure

OppSHOP
Related to this story
Income and total-return positioning requires evaluating asset allocation
Shop related →

Investing books
Read the classics
Shop this pick →

Personal finance books
Run the household books
Shop this pick →

Trading notebooks
Write the thesis first
Shop this pick →

Monitor for charts
See every pane
Shop this pick →
Based on reporting from yahoo-tickers-tape-movers.
Informational and educational only — not investment, financial, or legal advice. Disclosure
Shares a vertical MP4 loop to your phone's camera roll or app share sheet (Instagram, TikTok, Facebook Reels).