Barry, OppHub America Desk · · Source: yahoo-tickers-tape-movers
Schwab Dividend ETF Records Historic 5.5% Worst Year Loss
Income investors evaluate defensive equity vehicles based on historical drawdown profiles and yield characteristics.
Based on reporting from yahoo-tickers-tape-movers.
Between 2012 and 2025, the Schwab U.S. Dividend Equity ETF posted only three calendar-year declines, with a worst annual drop of 5.5% in 2018. Income investors navigating equity volatility examine how shallow drawdowns in high-yield vehicles contrast with broader market swings.
Market context for this story
As of: WeekendLoading quotes…
Informational only — not investment advice. Full markets →
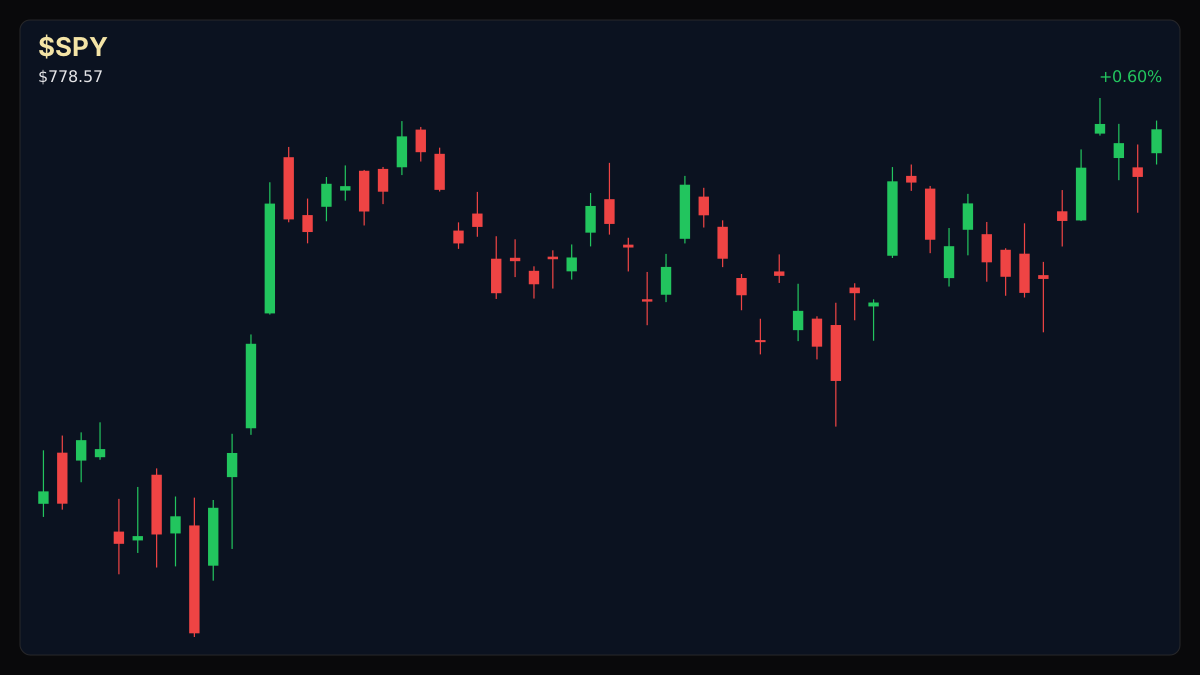
 SPDR S&P 500 ETF·$SPY
$SPYSPDR S&P 500 ETF
TradingView
Live chart & market data via TradingView · OppHub classroom · Delayed or exchange real-time per TradingView data agreements · Not investment advice
Educational TradingView chart — search any symbol in the widget. Confirm on /markets/SPY. Not investment advice.
Related markets
Shares a vertical MP4 loop to your phone's camera roll or app share sheet (Instagram, TikTok, Facebook Reels).
## Session Tape — Weekend Positioning
As markets close for the weekend session, tape metrics reflect broader large-cap index resilience alongside sector-specific rotations. Historical data for dividend-focused exchange-traded funds highlights distinct risk-reward profiles during market downturns.
## Catalyst Analysis: Historical Drawdowns and Opportunity Costs
Examining performance records from 2012 through 2025 reveals that the Schwab U.S. Dividend Equity ETF recorded only three negative calendar years, including paid dividends. The largest drawdown across this 14-year span occurred in 2018 at approximately 5.5%. During 2022—a period when the S&P 500 (^GSPC) fell roughly 18% inclusive of dividends—the dividend fund registered a relatively modest loss of about 3%.
While shallow drawdowns offer capital preservation during turbulent market phases, analysts note the structural trade-off: participation in bull markets can occasionally lag broader index advances when high-growth sectors dominate market leadership.
## Impact on Broad Index Vehicles
Income-oriented portfolios and broader equity benchmarks exhibit contrasting cyclical sensitivities. As investors balance defensive dividend strategies against high-beta growth allocations, historical volatility metrics continue to inform asset allocation models across major indices.
Read the full story
Original reporting and related coverage — attribution links only, not paid recommendations.
Trade this story
 Robinhood
 Webull
 Tradier
 IBKR
IBKR
Chart this story
 TradingView
Broker and exchange buttons use invite / refer-a-friend links (rewards may be capped). Charting links (TradingView) are partner offers that may pay OppHub America a commission at no extra cost to you.
OppSHOP
Full OppSHOP →As an Amazon Associate, OppHub America earns from qualifying purchases. Shopping here helps keep the site free — at no extra cost to you. Disclosure

OppSHOP
Related to this story
Income investors evaluate defensive equity vehicles based on historical
Shop related →

Investing books
Read the classics
Shop this pick →

Personal finance books
Run the household books
Shop this pick →

Trading notebooks
Write the thesis first
Shop this pick →

Monitor for charts
See every pane
Shop this pick →
Story playbook
A pre-built map of what to watch — stocks, ETFs, and educational next steps. Not personalized advice.
Snapshot date: October 11, 2026 at 7:47 AM ET
This playbook was built when the story published and is not live-updated. Prices, news, and risk can change after this date — treat it as a starting map, not a current trade ticket.
Story → money map
dividend income and capital preservation
Popular dividend-focused funds have historically protected investors from massive losses during bad stock market years. Regular people care because these funds offer peace of mind, though they might grow a bit slower when tech stocks are booming.
What changed
Historical performance data highlights exceptionally shallow drawdowns for major dividend exchange-traded funds during past market corrections.
Who wins / who loses
Conservative income investors benefit from lower volatility, while aggressive growth seekers may experience lower relative gains during market rallies.
Time horizon
Think in terms of the next few months.
Confidence & best fit
high confidence · Long-term investor, Side income / builder
Safer theme exposure (ETFs)
Baskets that own the theme without betting on one company.
Single stocks (higher risk)
Primary = closest to the story · Peers = same industry · Second-order = knock-on effects · Avoid = looks related but may be a trap
Primary
- $SCHDBuild slowly — only if it fits your plan
This is the main fund discussed in the story that helps investors collect dividends while avoiding big stock drops.
View $SCHD chart → · End-of-day delayed data
Peer
- $NOBLWatch — track, don’t rush
A similar basket of reliable dividend-paying stocks that also focuses on safety.
- $VIGWatch — track, don’t rush
Another fund filled with steady companies that increase their payouts over time.
Options (education only)
No strikes or expiries — a framework for how traders might express the view. Options can expire worthless.
Direction: range · Style: Covered-call income (only if you already own shares) · Level: beginner
You can think of this like renting out a room in a house you already own to make a little extra cash each month. Beginners should generally stick to simply owning the fund until comfortable.
Income / OppHub America angle
Not a trade tip — ways to use the insight outside the market.
- Reinvesting quarterly dividends automatically to compound long-term returns without timing the market.
What would break this thesis
- A prolonged structural shift where high-yield dividend stocks underperform risk-free Treasury yields by a wide margin.
What to do next on OppHub America
Saved playbooks stay on this device for now.
Important
Not financial advice. OppHub America playbooks are educational market maps only — not recommendations to buy, sell, or hold any security. Markets move fast; information can be wrong or outdated. Trade and invest at your own risk. Do your own research or consult a licensed advisor.
Based on reporting from yahoo-tickers-tape-movers.
Informational and educational only — not investment, financial, or legal advice. Disclosure
Shares a vertical MP4 loop to your phone's camera roll or app share sheet (Instagram, TikTok, Facebook Reels).