Barry, OppHub America Desk · · Source: yahoo-tickers-tape-movers
Semiconductor ETF Tests 15% Drawdown Rule After Record Close
Chips & export controls: Export controls and industrial policy are direct semis catalysts.
Based on reporting from yahoo-tickers-tape-movers.
The VanEck Semiconductor ETF retreated roughly 15% from its record close of $668.91, triggering a historical backtested strategy that tracks deep drawdowns in chip exposure. Analysts examine historical performance figures dating back to 2012 as the fund hovers near $565.
Market context for this story
As of: After HoursLoading quotes…
Informational only — not investment advice. Full markets →


$SMHVanEck Semiconductor ETF
TradingView
Live chart & market data via TradingView · OppHub classroom · Delayed or exchange real-time per TradingView data agreements · Not investment advice
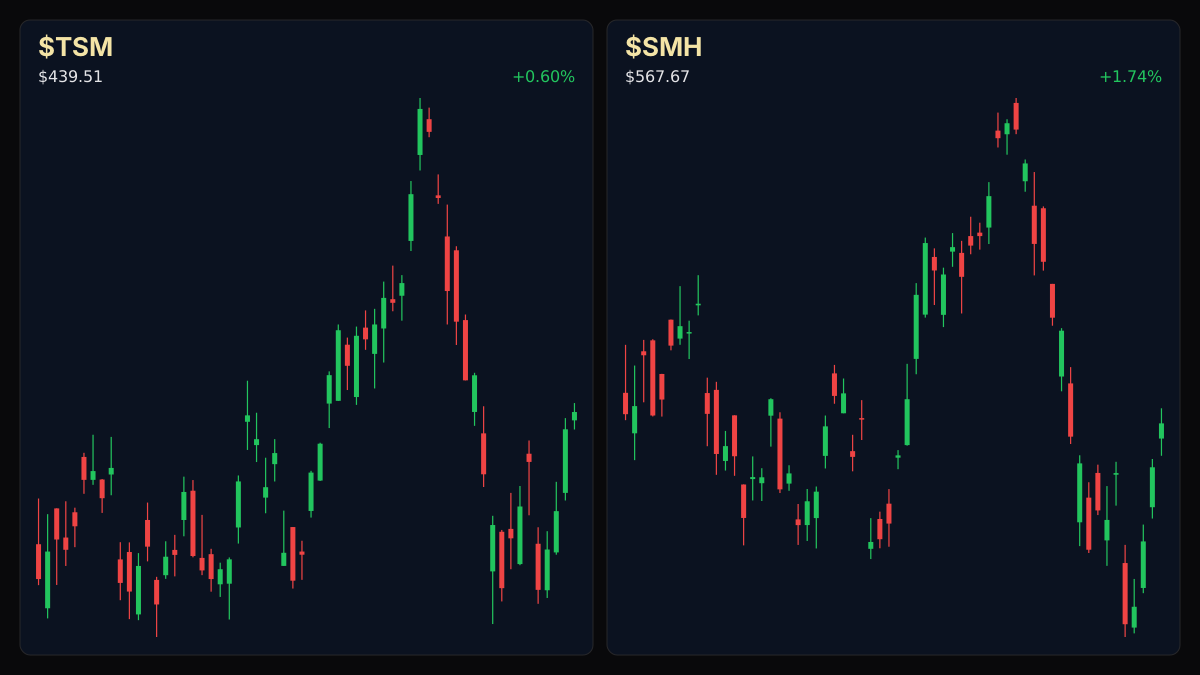
Educational TradingView chart — search any symbol in the widget. Confirm on /markets/SMH and related $TSM. Not investment advice.
Related markets
Shares a vertical MP4 loop to your phone's camera roll or app share sheet (Instagram, TikTok, Facebook Reels).
### Session Tape — Semiconductor ETF Drawdown Analysis - VanEck Semiconductor ETF: Evaluated following a retreat of approximately 15% from its record peak of $668.91 set on June 22.
## Catalyst Analysis: Historical Drawdown Strategy for Chip Exposure
The VanEck Semiconductor ETF reached a peak closing price of $668.91 on June 22 before pulling back to $556.53 by July 17, marking its first close at least 15% below that record high. Historical testing of a mechanical rule—buying the fund on the first day it closes 15% or more below a previous record and holding for one year—reveals varying outcomes across previous market cycles since 2012. Past signals have demonstrated strong subsequent one-year median gains, though drawdowns below the initial signal price occurred in several historical instances before eventual recovery.
### Money Play Traders assessing historical sector drawdowns can review long-term cyclical patterns in semiconductor equities without specific ticker catalysts.
Read the full story
Original reporting and related coverage — attribution links only, not paid recommendations.
Trade this story
 Robinhood
 Webull
 Tradier
 IBKR
Chart this story
 TradingView
Broker and exchange buttons use invite / refer-a-friend links (rewards may be capped). Charting links (TradingView) are partner offers that may pay OppHub America a commission at no extra cost to you.
OppSHOP
Full OppSHOP →As an Amazon Associate, OppHub America earns from qualifying purchases. Shopping here helps keep the site free — at no extra cost to you. Disclosure

OppSHOP
Related to this story
Chips & export controls: Export controls and industrial policy are direc
Shop related →

Investing books
Read the classics
Shop this pick →

Personal finance books
Run the household books
Shop this pick →

Trading notebooks
Write the thesis first
Shop this pick →

Monitor for charts
See every pane
Shop this pick →
Story playbook
A pre-built map of what to watch — stocks, ETFs, and educational next steps. Not personalized advice.
Snapshot date: October 28, 2026 at 11:01 PM ET
This playbook was built when the story published and is not live-updated. Prices, news, and risk can change after this date — treat it as a starting map, not a current trade ticket.
Story → money map
Semiconductor Drawdown
A major semiconductor stock fund has dropped 15% from its highest price ever. Investors are looking at past history to see if this drop is a good chance to buy chips for the long run.
What changed
The VanEck Semiconductor ETF experienced a 15% retreat from its record high, triggering a historical drawdown strategy review.
Who wins / who loses
Diversified semiconductor funds and long-term accumulators may benefit, while short-term momentum traders face heightened volatility and drawdown risks.
Time horizon
Think in terms of the next few months.
Confidence & best fit
medium confidence · Long-term investor, Active trader
Safer theme exposure (ETFs)
Baskets that own the theme without betting on one company.
Single stocks (higher risk)
Primary = closest to the story · Peers = same industry · Second-order = knock-on effects · Avoid = looks related but may be a trap
Primary
- $SMHWatch — track, don’t rush
The exact fund mentioned in the article that has dropped 15% from its record high.
View $SMH chart → · End-of-day delayed data
Peer
- $TSMWatch — track, don’t rush
A top chip manufacturer that moves up and down with the rest of the semiconductor industry.
View $TSM chart → · End-of-day delayed data
- $NVDAWatch — track, don’t rush
The biggest name in artificial intelligence chips, which is affected when the whole chip sector dips.
View $NVDA chart → · End-of-day delayed data
Options (education only)
No strikes or expiries — a framework for how traders might express the view. Options can expire worthless.
Direction: bullish · Style: Bullish defined-risk call idea · Level: intermediate
Beginners should skip options because sudden drops in chip stocks can make options lose value quickly.
Income / OppHub America angle
Not a trade tip — ways to use the insight outside the market.
- Review personal portfolio exposure to technology and semiconductor weightings.
What would break this thesis
- Deeper macroeconomic deterioration or severe export controls causing structural declines beyond typical cyclical drawdowns.
What to do next on OppHub America
Saved playbooks stay on this device for now.
Important
Not financial advice. OppHub America playbooks are educational market maps only — not recommendations to buy, sell, or hold any security. Markets move fast; information can be wrong or outdated. Trade and invest at your own risk. Do your own research or consult a licensed advisor.
Based on reporting from yahoo-tickers-tape-movers.
Informational and educational only — not investment, financial, or legal advice. Disclosure
Shares a vertical MP4 loop to your phone's camera roll or app share sheet (Instagram, TikTok, Facebook Reels).