Barry, OppHub America Desk · · Source: yahoo-tickers-tape-movers
ServiceNow (NOW): Cash Flow Valuations Signal Upside Despite Stock Dip
If intrinsic valuation models highlighting cash flow continue to gain investor traction, watch ServiceNow ($NOW+WL) as the stock has seen a 22.7% decline over the past year, potentially offering a more attractive entry point based on these metrics. Similarly, investors might observe Ares Management Corporation for broader market appetite in growth-oriented sectors, given its investment activities and recent price movement.
Based on reporting from yahoo-tickers-tape-movers.
ServiceNow (NYSE: NOW) shares have declined 22.7% over the past year, yet a key valuation model suggests the stock may be undervalued. This assessment contrasts with traditional market multiples, which imply that current prices already reflect substantial quality.
Market context for this story
As of: WeekendLoading quotes…
Informational only — not investment advice. Full markets →


$NOWServiceNow
TradingView
Live chart & market data via TradingView · OppHub classroom · Delayed or exchange real-time per TradingView data agreements · Not investment advice
Educational TradingView chart — search any symbol in the widget. Confirm on /markets/NOW and related $ARES. Not investment advice.
Related markets
Shares a vertical MP4 loop to your phone's camera roll or app share sheet (Instagram, TikTok, Facebook Reels).
ServiceNow (NYSE: NOW) shares have declined 22.7% over the past year, prompting a debate among investors regarding its current valuation. While some intrinsic value models point to potential undervaluation, broader market multiples suggest that much of the company's quality is already priced into the stock.
### Money Play Investors tracking software-as-a-service (SaaS) firms should monitor $NOW+WL for potential divergence between intrinsic value assessments and traditional valuation metrics, particularly after its significant year-over-year decline. The ongoing debate presents a nuanced opportunity for those analyzing fundamental cash flow against market price. For instance, Ares Management Corporation (NYSE: ARES) could offer insight into broader investment trends in enterprise software, given its exposure to similar growth-oriented sectors.
## Catalyst Analysis: Valuation Divergence The primary driver of current market discussion around ServiceNow is the notable divergence in valuation perspectives. Despite a 22.7% decline in its stock price over the past year, some valuation models indicate a substantial upside based on factors like cash flow. This contradicts traditional market multiples, which suggest the stock is already reflecting a high degree of quality, implying limited near-term upside from current levels.
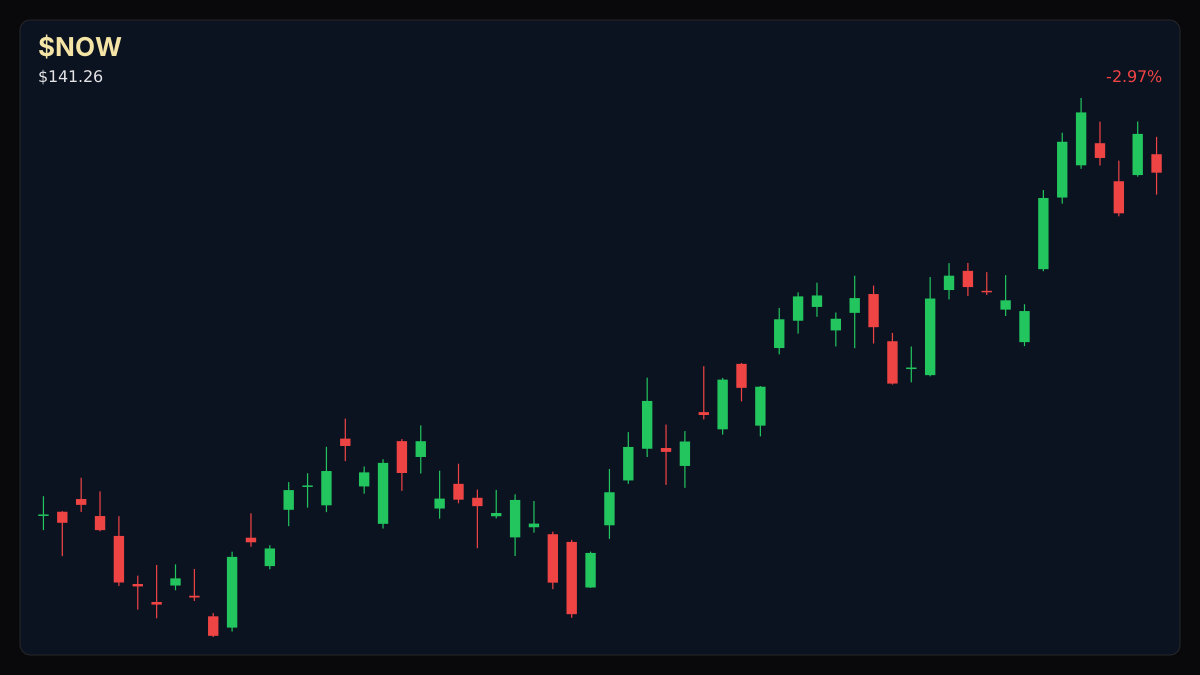
## $NOW+WL Technical Analysis & Key Risk Watch $NOW+WL last traded at $128.05. The stock's current RSI14 stands at 62.6, with a volume multiple of 0.42x compared to its 20-day average. The share price is currently above its 50-day simple moving average of $109.42 and its 200-day simple moving average of $120.06. Key levels for $NOW+WL (educational): R2 $129.75 · R1 $128.08 · last $128.05 · S1 $127.59 · S2 $124.12. The key risk remains the gap between differing valuation methodologies and how market sentiment ultimately weighs these factors.
### Sector Ripple / Impact on Enterprise Software The valuation debate surrounding ServiceNow could have broader implications for the enterprise software sector. If cash flow-based intrinsic valuations gain traction, it might highlight other software companies trading at what appear to be stretched traditional multiples but possess strong underlying cash generation. Conversely, if market multiples continue to dominate investor perception, it could reinforce caution around high-growth tech stocks, potentially affecting sentiment for firms like Ares Management Corporation (NYSE: ARES) that operate in related investment areas.
Read the full story
Original reporting and related coverage — attribution links only, not paid recommendations.
Trade this story
 Robinhood
 Webull
 Tradier
 IBKR
IBKR
Chart this story
 TradingView
Broker and exchange buttons use invite / refer-a-friend links (rewards may be capped). Charting links (TradingView) are partner offers that may pay OppHub America a commission at no extra cost to you.
OppSHOP
Full OppSHOP →As an Amazon Associate, OppHub America earns from qualifying purchases. Shopping here helps keep the site free — at no extra cost to you. Disclosure

OppSHOP
Related to this story
If intrinsic valuation models highlighting cash flow continue to gain in
Shop related →

Investing books
Read the classics
Shop this pick →

Personal finance books
Run the household books
Shop this pick →

Trading notebooks
Write the thesis first
Shop this pick →

Monitor for charts
See every pane
Shop this pick →
Story playbook
A pre-built map of what to watch — stocks, ETFs, and educational next steps. Not personalized advice.
Snapshot date: September 5, 2026 at 2:30 AM ET
This playbook was built when the story published and is not live-updated. Prices, news, and risk can change after this date — treat it as a starting map, not a current trade ticket.
Story → money map
Enterprise SaaS valuation divergence
ServiceNow stock has gone down significantly over the last year, but some math models show it might actually be a bargain based on the cash it brings in. People who invest money are watching to see if the market changes its mind and decides the stock is worth more.
What changed
A significant one-year price decline in ServiceNow has triggered a debate over whether cash flow valuations reveal hidden upside compared to traditional market multiples.
Who wins / who loses
Patient investors looking for discounted enterprise software benefit if cash flow models prove correct, while short-term momentum traders may lose if high valuation multiples continue to compress.
Time horizon
Think in terms of the next few months.
Confidence & best fit
medium confidence · Long-term investor
Safer theme exposure (ETFs)
Baskets that own the theme without betting on one company.
- $IGV — A basket of many software companies so you don't have to risk everything on just one stock.
- $SKYY — An ETF focused on cloud computing companies, capturing broader tech trends safely.
Single stocks (higher risk)
Primary = closest to the story · Peers = same industry · Second-order = knock-on effects · Avoid = looks related but may be a trap
Primary
- $NOWWatch — track, don’t rush
The main company in the story; its stock dropped, but some financial models suggest it is cheaper than it should be.
View $NOW chart → · End-of-day delayed data
Peer
- $WORKStay away — for now
Another workplace software company used to compare industry trends.
Second-order
- $ARESWatch — track, don’t rush
An investment firm that can show how big money feels about the software industry right now.
View $ARES chart → · End-of-day delayed data
Options (education only)
No strikes or expiries — a framework for how traders might express the view. Options can expire worthless.
Beginners should skip options here and stick to watching the stock or using an ETF because the future direction is still uncertain.
See options-friendly brokers →Income / OppHub America angle
Not a trade tip — ways to use the insight outside the market.
- Monitor enterprise software spending reports and IT budget forecasts from major industry surveys.
What would break this thesis
- Broader market multiple contraction driving tech valuations even lower
- Deterioration in ServiceNow free cash flow generation
What to do next on OppHub America
Saved playbooks stay on this device for now.
Important
Not financial advice. OppHub America playbooks are educational market maps only — not recommendations to buy, sell, or hold any security. Markets move fast; information can be wrong or outdated. Trade and invest at your own risk. Do your own research or consult a licensed advisor.
Based on reporting from yahoo-tickers-tape-movers.
Informational and educational only — not investment, financial, or legal advice. Disclosure
Shares a vertical MP4 loop to your phone's camera roll or app share sheet (Instagram, TikTok, Facebook Reels).