Barry, OppHub America Desk · · Source: yahoo-tickers-rotation
ServiceNow (NOW) Q2 Revenue Rises 24% Amid 35% FCF Target
If subscription revenue growth sustains above 20% alongside target margins, watch because enterprise workflow expansion directly supports multiple stability.
Based on reporting from yahoo-tickers-rotation.
ServiceNow (NYSE: NOW) reported 24% year-over-year revenue growth to $3.99 billion in its latest reporting period, underpinned by expansion in subscription lines. Traders and investors are weighing whether strong enterprise demand and a projected 35% non-GAAP free cash flow margin for 2026 can justify the software platform's valuation relative to equity-based compensation costs.
Market context for this story
As of: After HoursLoading quotes…
Informational only — not investment advice. Full markets →
 ServiceNow·$NOW
$NOWServiceNow
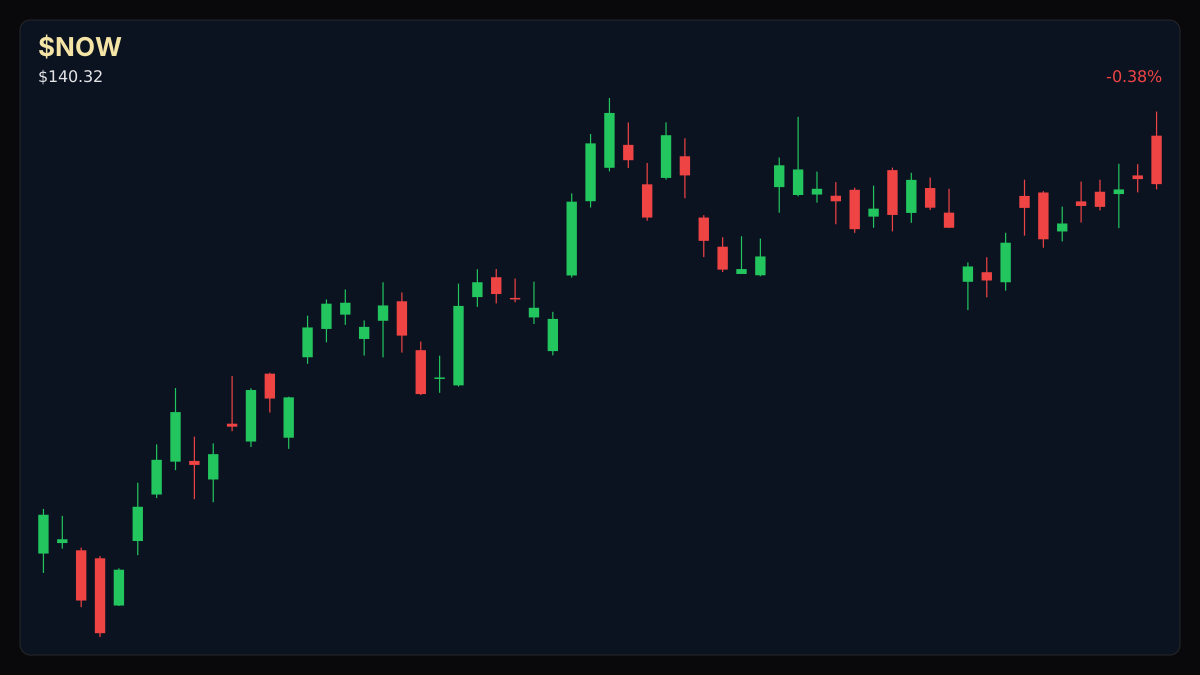
TradingView
Live chart & market data via TradingView · OppHub classroom · Delayed or exchange real-time per TradingView data agreements · Not investment advice
Educational TradingView chart — search any symbol in the widget. Confirm on /markets/NOW. Not investment advice.
Related markets
Shares a vertical MP4 loop to your phone's camera roll or app share sheet (Instagram, TikTok, Facebook Reels).
ServiceNow, Inc. (NYSE: NOW) posted 24% year-over-year revenue growth to $3.99 billion for the second quarter, driven by accelerating enterprise adoption across subscription workflows.
### Tape / Session Read Subscription revenue climbed 24.5% year-over-year to $3.88 billion, while current remaining performance obligations advanced 21% to $13.2 billion. Total remaining contract value expanded nearly 40% year-over-year, reflecting sustained institutional demand for enterprise automation tools. Management targets a 35% non-GAAP free cash flow margin for 2026.
### Why This Lane Matters Robust top-line expansion in enterprise software highlights ongoing capital allocation toward digital workflows and cloud automation. However, market participants must weigh scaling cash flows against equity-based compensation expenses recorded during the period.
### Story Arc / How We Got Here This update builds on our prior coverage of expanding cloud management demand across enterprise software ecosystems, detailed in our analysis of AIOps & Cloud Demand Drive IT Market Growth (/explore/aiops-cloud-demand-drive-it-market-growth).
### Money Play - If subscription revenue growth sustains above 20% alongside target FCF margins, watch $NOW+WL because enterprise workflow expansion directly supports multiple stability.
Read the full story
Original reporting and related coverage — attribution links only, not paid recommendations.
Trade this story (crypto)
 Coinbase
 Gemini
 Robinhood
 Webull
Chart this story
 TradingView
Broker and exchange buttons use invite / refer-a-friend links (rewards may be capped). Charting links (TradingView) are partner offers that may pay OppHub America a commission at no extra cost to you.
OppSHOP
Full OppSHOP →As an Amazon Associate, OppHub America earns from qualifying purchases. Shopping here helps keep the site free — at no extra cost to you. Disclosure

OppSHOP
Related to this story
If subscription revenue growth sustains above 20% alongside target margi
Shop related →

Investing books
Read the classics
Shop this pick →

Personal finance books
Run the household books
Shop this pick →

Trading notebooks
Write the thesis first
Shop this pick →

Monitor for charts
See every pane
Shop this pick →
Story playbook
A pre-built map of what to watch — stocks, ETFs, and educational next steps. Not personalized advice.
Snapshot date: October 13, 2026 at 9:00 PM ET
This playbook was built when the story published and is not live-updated. Prices, news, and risk can change after this date — treat it as a starting map, not a current trade ticket.
Story → money map
Enterprise cloud workflow automation
ServiceNow showed strong business growth with sales up nearly a quarter compared to last year. People who invest money are watching to see if this success makes the high stock price worth it.
What changed
ServiceNow reported robust Q2 revenue growth of 24% and reiterated ambitious 2026 cash flow goals.
Who wins / who loses
Enterprise cloud workflow providers and automation leaders benefit from sustained corporate IT budgets, while software firms with heavy dilution or slowing growth risk multiple contraction.
Time horizon
Think in terms of the next few months.
Confidence & best fit
medium confidence · Long-term investor, Active trader
Safer theme exposure (ETFs)
Baskets that own the theme without betting on one company.
- $IGV — A basket of many software companies, lowering the risk of owning just one stock.
- $SKYY — An index fund focused entirely on cloud computing services.
Single stocks (higher risk)
Primary = closest to the story · Peers = same industry · Second-order = knock-on effects · Avoid = looks related but may be a trap
Primary
- $NOWWatch — track, don’t rush
The main company in the news; we are watching if their strong business growth continues.
View $NOW chart → · End-of-day delayed data
Peer
- $WDAYWatch — track, don’t rush
A similar business software company that often moves in the same direction.
View $WDAY chart → · End-of-day delayed data
Second-order
- $TEAMWatch — track, don’t rush
Another tech platform influenced by how much companies are spending on software.
View $TEAM chart → · End-of-day delayed data
Options (education only)
No strikes or expiries — a framework for how traders might express the view. Options can expire worthless.
Beginners should skip options here because tech software stocks can swing sharply on earnings and market moods.
See options-friendly brokers →Income / OppHub America angle
Not a trade tip — ways to use the insight outside the market.
- Upskill in enterprise IT workflow architecture and cloud automation tools.
What would break this thesis
- Subscription revenue growth falling below 20%
- Significant deceleration in remaining performance obligations
What to do next on OppHub America
Saved playbooks stay on this device for now.
Important
Not financial advice. OppHub America playbooks are educational market maps only — not recommendations to buy, sell, or hold any security. Markets move fast; information can be wrong or outdated. Trade and invest at your own risk. Do your own research or consult a licensed advisor.
Aftermath · $NVDA
-4.34% vs write
- •Since this piece: $NVDA is down -4.34% vs $238.90 at write time (now $228.52).
- •Session move (Yahoo delayed): +0.97%.
- •RSI14 at write was 84.6 — compare levels on Markets, not advice.
- •Original money play lens: If subscription revenue growth sustains above 20% alongside target margins, watch because enterprise workflow expansion directly supports multiple stability.
- •Track $NVDA live on OppHub Markets (/markets/NVDA). Not financial advice.
Based on reporting from yahoo-tickers-rotation.
Informational and educational only — not investment, financial, or legal advice. Disclosure
Shares a vertical MP4 loop to your phone's camera roll or app share sheet (Instagram, TikTok, Facebook Reels).