OppHub America Desk · · Source: yahoo-megacap-tickers
SK Hynix Revenue Surge Points to Semiconductor Cyclicality Risks
Investors should monitor Hynix's valuation for insights into broader market sentiment regarding cyclical industries, as a low forward earnings multiple despite high growth can signal perceived risk for the semiconductor sector.
Based on reporting from yahoo-megacap-tickers.
SK Hynix's revenue rose 257% annually in Q2 2026, driven by demand for its high-bandwidth memory (HBM) chips, yet its valuation suggests potential market concerns about the cyclical nature of the semiconductor industry. Investors are watching how sustained growth in HBM will affect future earnings multiples for chipmakers.
Market context for this story
As of: WeekendLoading quotes…
Informational only — not investment advice. Full markets →


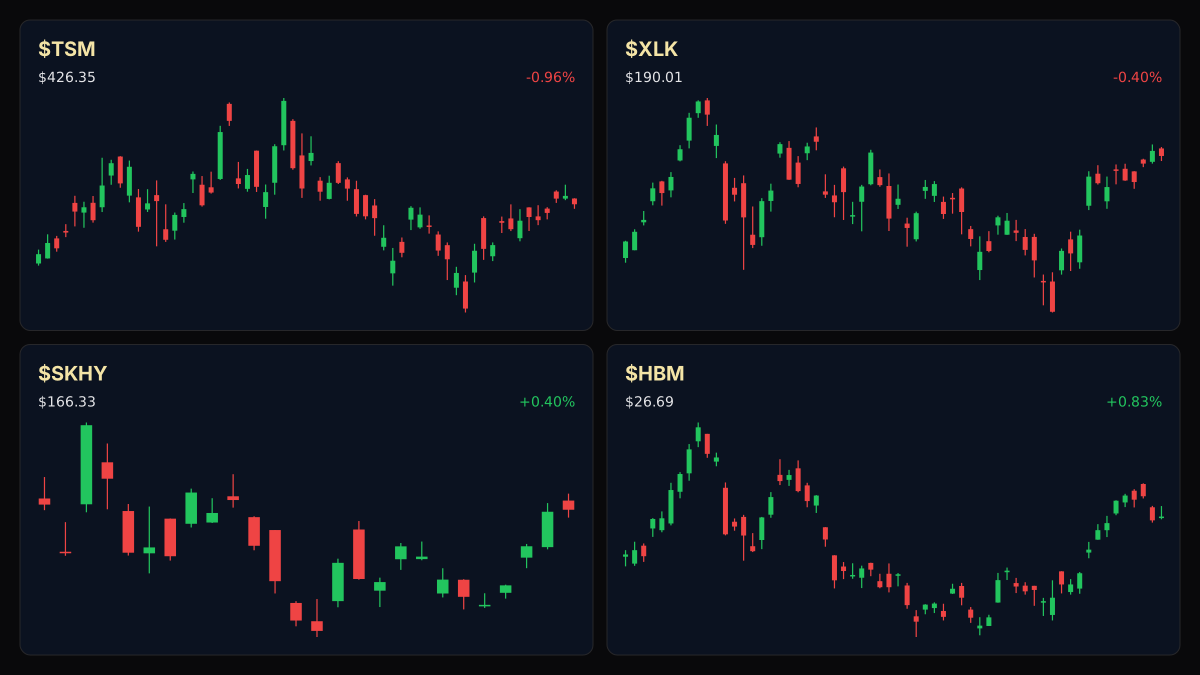
$TSM
TradingView
Live chart & market data via TradingView · OppHub classroom · Delayed or exchange real-time per TradingView data agreements · Not investment advice
$HBM
TradingView
Live chart & market data via TradingView · OppHub classroom · Delayed or exchange real-time per TradingView data agreements · Not investment advice
Educational TradingView charts — search any symbol in the widget. Confirm on /markets/TSM and related $HBM, $NVDA, $MSFT. Not investment advice.
Related markets
Shares a vertical MP4 loop to your phone's camera roll or app share sheet (Instagram, TikTok, Facebook Reels).
Memory chip producer SK Hynix saw its second-quarter 2026 revenue climb 257% year-over-year, with net income surging 1,242% to approximately 94 trillion won ($66 billion). This substantial growth is primarily attributed to robust demand for its high-bandwidth memory (HBM) chips, where SK Hynix holds a 58% market share, according to Counterpoint Research. Despite this performance, the company's valuation, trading around five times next year's earnings, signals investor caution regarding the cyclical patterns historically observed in the semiconductor sector.
### Story Arc / How We Got Here
Today's robust revenue figures for SK Hynix underscore the continued demand for advanced memory solutions, a trend that has significantly impacted the broader semiconductor market. This momentum follows previous observations of exceptional growth within the memory chip industry. As noted in prior coverage on August 9, 2026, "Micron Has Surged 207% This Year. Brace for a Steep Pullback" (/explore/micron-has-surged-207-this-year-brace-for-a-steep-pullback), Micron Technology's stock had experienced a 207% increase that year. The current SK Hynix report suggests that while growth remains strong, the market continues to price in potential future cyclical downturns for the sector.
### Tape / Session Read
Major technology stocks experienced mixed movements in the last session. Nvidia (NASDAQ: NVDA) declined 2.86%, Microsoft (NASDAQ: MSFT) advanced 1.21%, and Alphabet (NASDAQ: GOOGL) fell 0.96%. These movements reflect broader market uncertainty and specific responses to individual company news and sector dynamics.
### Why This Lane Matters
The performance of key semiconductor players like SK Hynix is a critical indicator for U.S. risk appetite in the technology sector and broader industrial trends. The high demand for HBM chips highlights the rapid expansion of AI infrastructure, which continues to drive investment and innovation. However, the market's cautious valuation of SK Hynix, despite its strong growth, suggests that investors are factoring in the historical volatility of the memory chip business, potentially impacting sentiment towards other cyclical technology components.
## $HBM+WL Technical Analysis & Key Risk Watch
While SK Hynix (SKHY) itself is not a U.S.-listed ETF, the high-bandwidth memory (HBM) sector it dominates is integral to the broader technology market. The underlying demand for HBM continues to be strong, influencing related U.S. tech stocks and sector ETFs. Nvidia (NASDAQ: NVDA) ended the last session at $217.55, with key levels at R2 $222.22, R1 $217.86, S1 $217.00, and S2 $214.80. Its RSI14 stood at 57.5, with volume at 0.91x its 20-day average. Microsoft (NASDAQ: MSFT) closed at $506.06, exhibiting key levels at R2 $531.36, R1 $513.73, S1 $502.27, and S2 $479.17. Its RSI14 was 84.5, with volume at 0.78x its 20-day average, indicating potential overbought conditions. Alphabet (NASDAQ: GOOGL) finished at $354.30, with key levels at R2 $358.62, R1 $354.35, S1 $353.78, and S2 $351.75. Its RSI14 was 50.9, and volume was 0.61x its 20-day average.
Read the full story
Original reporting and related coverage — attribution links only, not paid recommendations.
Trade this story
 Robinhood
 Webull
 Tradier
 IBKR
IBKR
Chart this story
 TradingView
Broker and exchange buttons use invite / refer-a-friend links (rewards may be capped). Charting links (TradingView) are partner offers that may pay OppHub America a commission at no extra cost to you.
OppSHOP
Full OppSHOP →As an Amazon Associate, OppHub America earns from qualifying purchases. Shopping here helps keep the site free — at no extra cost to you. Disclosure

OppSHOP
Related to this story
Investors should monitor Hynix's valuation for insights into broader mar
Shop related →

Investing books
Read the classics
Shop this pick →

Personal finance books
Run the household books
Shop this pick →

Trading notebooks
Write the thesis first
Shop this pick →

Monitor for charts
See every pane
Shop this pick →
Based on reporting from yahoo-megacap-tickers.
Informational and educational only — not investment, financial, or legal advice. Disclosure
Shares a vertical MP4 loop to your phone's camera roll or app share sheet (Instagram, TikTok, Facebook Reels).