Barry, OppHub America Desk · · Source: yahoo-tickers-tape-movers
S&P 500 AI Exposure: Capital Economics Weighs Bust Risks
Monitor broad index constituents across infrastructure and platform segments for relative strength divergence as macroeconomic and regulatory pressures test high-multiple equity valuations.
Based on reporting from yahoo-tickers-tape-movers.
Approximately half of the S&P 500's market capitalization holds artificial intelligence exposure across five ecosystem categories, according to Capital Economics analysis released on Sunday, November 22, 2026. The research follows a steep tech sector sell-off as market participants weigh debt-fueled financing, uncertain returns, and governance pressures.
Market context for this story
As of: WeekendLoading quotes…
Informational only — not investment advice. Full markets →

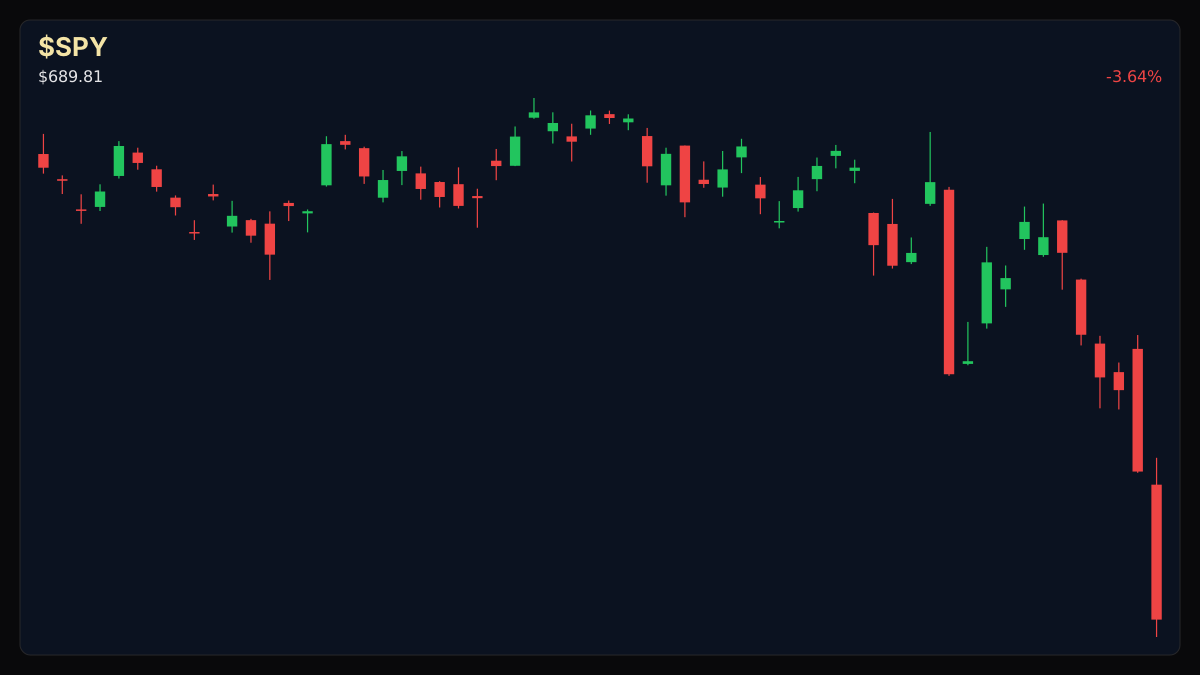
$SPYSPDR S&P 500 ETF
TradingView
Live chart & market data via TradingView · OppHub classroom · Delayed or exchange real-time per TradingView data agreements · Not investment advice
Educational TradingView chart — search any symbol in the widget. Confirm on /markets/SPY. Not investment advice.
Related markets
Shares a vertical MP4 loop to your phone's camera roll or app share sheet (Instagram, TikTok, Facebook Reels).
### Tape / Session Read Capital Economics analysis indicates that roughly 50% of the S&P 500 by market capitalization maintains positive exposure to artificial intelligence, split across five distinct segments: physical infrastructure, platform cloud providers, technology adopters, disrupted entities, and neutral firms. Recent sessions saw the benchmark S&P 500 experience its sharpest weekly pullback since April 2025, pushing Wall Street into correction territory amid debt-financing concerns and governance headwinds surrounding key AI participants.
### Why This Lane Matters Broad index exposure to artificial intelligence creates systemic vulnerability when sentiment shifts across hardware suppliers and cloud builders. Disconnects between semiconductor producers and hyperscalers earlier in the year highlight how downside risks can fracture the broader equity tape differently depending on whether regulatory tightening or productivity doubts drive the correction.
### Money Play Capital Economics projects potential downside for the broader benchmark heading toward year-end, underscoring the importance of monitoring sector-specific basket bifurcation—such as infrastructure versus platform holding power—rather than treating the AI ecosystem as a single monolith.
Read the full story
Original reporting and related coverage — attribution links only, not paid recommendations.
Trade this story
 Robinhood
 Webull
 Tradier
 IBKR
Chart this story
 TradingView
Broker and exchange buttons use invite / refer-a-friend links (rewards may be capped). Charting links (TradingView) are partner offers that may pay OppHub America a commission at no extra cost to you.
OppSHOP
Full OppSHOP →As an Amazon Associate, OppHub America earns from qualifying purchases. Shopping here helps keep the site free — at no extra cost to you. Disclosure

OppSHOP
Related to this story
Monitor broad index constituents across infrastructure and platform segm
Shop related →

Investing books
Read the classics
Shop this pick →

Personal finance books
Run the household books
Shop this pick →

Trading notebooks
Write the thesis first
Shop this pick →
Monitor for charts
See every pane
Shop this pick →
Story playbook
A pre-built map of what to watch — stocks, ETFs, and educational next steps. Not personalized advice.
Snapshot date: November 22, 2026 at 4:31 PM ET
This playbook was built when the story published and is not live-updated. Prices, news, and risk can change after this date — treat it as a starting map, not a current trade ticket.
Story → money map
AI bubble risks
A new report shows that half of the stock market relies on artificial intelligence in some way, which has caused heavy selling recently as investors worry about debt and slow profits. People care because trouble in AI tech stocks can pull down the entire stock market.
What changed
Capital Economics reported that half of the S&P 500 has AI exposure, coinciding with a sharp tech sector pullback over debt and governance concerns.
Who wins / who loses
Diversified value sectors and defensive stocks may benefit from capital rotation, while highly leveraged AI infrastructure providers face downside pressure.
Time horizon
Think in terms of the next few weeks.
Confidence & best fit
medium confidence · Long-term investor, Active trader
Safer theme exposure (ETFs)
Baskets that own the theme without betting on one company.
- $SPY — An investment that tracks the entire S&P 500 stock market, showing how overall market health is tied to AI.
- $QQQ — A basket of the biggest technology companies, great for tracking how tech and AI trends are moving.
- $XLK — A fund focused purely on technology stocks, which gives concentrated exposure to the AI boom or bust.
Single stocks (higher risk)
Primary = closest to the story · Peers = same industry · Second-order = knock-on effects · Avoid = looks related but may be a trap
Primary
- $NVDAWatch — track, don’t rush
The biggest maker of artificial intelligence chips; if its stock drops, it usually drags down the rest of the market.
View $NVDA chart → · End-of-day delayed data
- $MSFTWatch — track, don’t rush
A huge software and cloud company spending heavily on AI; investors are watching to see if it makes that money back.
View $MSFT chart → · End-of-day delayed data
Peer
- $GOOGLWatch — track, don’t rush
Google's parent company, which is heavily investing in AI and faces similar spending pressures as its peers.
View $GOOGL chart → · End-of-day delayed data
Second-order
- $XLUBuild slowly — only if it fits your plan
Utility companies that provide steady electricity and dividends; money often flows here when tech stocks fall.
View $XLU chart → · End-of-day delayed data
Options (education only)
No strikes or expiries — a framework for how traders might express the view. Options can expire worthless.
Direction: volatile · Style: Protective put / downside hedge idea · Level: intermediate
Think of this like buying insurance for your stock portfolio in case the overall market drops further. Beginners should generally skip options and stick to holding cash or safer funds.
Income / OppHub America angle
Not a trade tip — ways to use the insight outside the market.
- Review overall portfolio concentration in mega-cap technology to ensure risk alignment with broader market corrections.
What would break this thesis
- Rapid rebound in tech sector earnings reports and easing debt-financing costs.
What to do next on OppHub America
Saved playbooks stay on this device for now.
Important
Not financial advice. OppHub America playbooks are educational market maps only — not recommendations to buy, sell, or hold any security. Markets move fast; information can be wrong or outdated. Trade and invest at your own risk. Do your own research or consult a licensed advisor.
Based on reporting from yahoo-tickers-tape-movers.
Informational and educational only — not investment, financial, or legal advice. Disclosure
Shares a vertical MP4 loop to your phone's camera roll or app share sheet (Instagram, TikTok, Facebook Reels).