Barry, OppHub America Desk · · Source: seeking-alpha
S&P 500 Closes September Down 0.45% After August Gain
Review portfolio cash allocation rules and moving average thresholds when multi-asset models signal defensive shifts.
Based on reporting from seeking-alpha.
The S&P 500 declined 0.45% in September after gaining 2.6% in August, finishing the month above its key 10-month and 12-month moving averages according to the latest Ivy Portfolio data published on Wednesday, October 1, 2026. Investors tracking broad index positioning can evaluate how moving average thresholds maintain trend discipline through monthly shifts.
Market context for this story
As of: After HoursLoading quotes…
Informational only — not investment advice. Full markets →


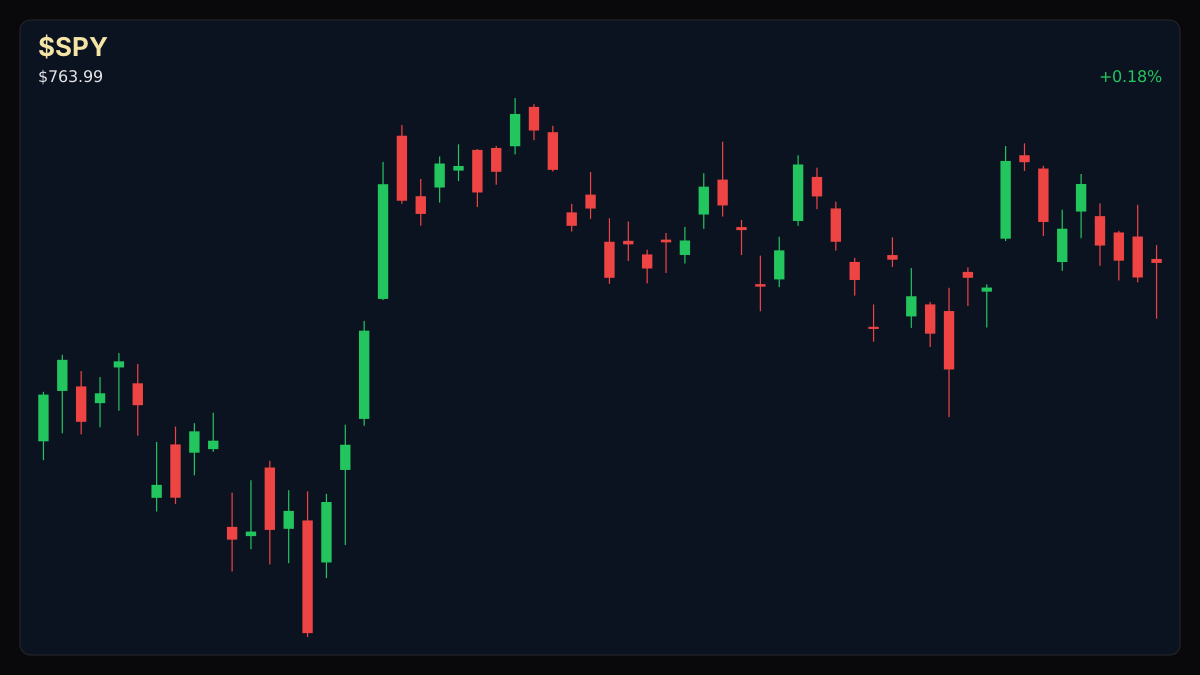
$SPYSPDR S&P 500 ETF
TradingView
Live chart & market data via TradingView · OppHub classroom · Delayed or exchange real-time per TradingView data agreements · Not investment advice
Educational TradingView chart — search any symbol in the widget. Confirm on /markets/SPY and related $VNQ. Not investment advice.
Related markets
Shares a vertical MP4 loop to your phone's camera roll or app share sheet (Instagram, TikTok, Facebook Reels).
### Tape / Session Read The S&P 500 pulled back 0.45% in September following a 2.6% advance in August, yet closed the month above its 10-month simple and exponential moving averages, as well as its 12-month simple moving average. Ivy Portfolio tracking showed two cash positions across the IEF and VNQ exchange-traded funds at the close of the September business cycle.
### Why This Lane Matters Monthly moving average tracking provides portfolio managers with structured checkpoints for risk allocation, separating routine consolidation from structural trend reversals in broader equity benchmarks.
### Money Play Investors reviewing monthly model signals should monitor cash positioning rules within multi-asset frameworks as broader index benchmarks test intermediate moving average boundaries.
## S&P 500 Technical Analysis & Key Risk Watch — Monthly Trend Stance
10.85 · R1 ## S&P 500 Technical Analysis & Key Risk Watch — Monthly Trend Stance 09.19 · last ## S&P 500 Technical Analysis & Key Risk Watch — Monthly Trend Stance 08.60 · S1 ## S&P 500 Technical Analysis & Key Risk Watch — Monthly Trend Stance 08.30 · S2 ## S&P 500 Technical Analysis & Key Risk Watch — Monthly Trend Stance 04.41.
As the broader equity tape navigates post-summer consolidation, market participants continue to monitor whether benchmark indices maintain their multi-month moving average floors following September's minor contraction.
Read the full story
Original reporting and related coverage — attribution links only, not paid recommendations.
Trade this story
 Robinhood
 Webull
 Tradier
 IBKR
IBKR
Chart this story
 TradingView
Broker and exchange buttons use invite / refer-a-friend links (rewards may be capped). Charting links (TradingView) are partner offers that may pay OppHub America a commission at no extra cost to you.
OppSHOP
Full OppSHOP →As an Amazon Associate, OppHub America earns from qualifying purchases. Shopping here helps keep the site free — at no extra cost to you. Disclosure

OppSHOP
Related to this story
Review portfolio cash allocation rules and moving average thresholds whe
Shop related →

Investing books
Read the classics
Shop this pick →

Personal finance books
Run the household books
Shop this pick →

Trading notebooks
Write the thesis first
Shop this pick →

Monitor for charts
See every pane
Shop this pick →
Story playbook
A pre-built map of what to watch — stocks, ETFs, and educational next steps. Not personalized advice.
Snapshot date: October 1, 2026 at 11:01 PM ET
This playbook was built when the story published and is not live-updated. Prices, news, and risk can change after this date — treat it as a starting map, not a current trade ticket.
Story → money map
broad market moving averages
The stock market went down slightly in September after going up in August, but it is still staying above important long-term health lines. Investors care about this because it helps them decide when to play safe and hold cash versus when to stay invested.
What changed
The S&P 500 posted a modest 0.45% monthly pullback in September while remaining above its vital 10-month and 12-month moving averages.
Who wins / who loses
Defensive asset holders and cash-backed strategies benefit from consolidation, while aggressive growth chasers face choppy trend tests.
Time horizon
Think in terms of the next few weeks.
Confidence & best fit
medium confidence · Long-term investor, Active trader
Safer theme exposure (ETFs)
Baskets that own the theme without betting on one company.
Single stocks (higher risk)
Primary = closest to the story · Peers = same industry · Second-order = knock-on effects · Avoid = looks related but may be a trap
Primary
- $IEFBuild slowly — only if it fits your plan
Government bond fund used as a safe place to hold cash while the stock market takes a breather.
Peer
- $VNQWatch — track, don’t rush
Real estate fund tracked as part of the broader conservative strategy mix.
View $VNQ chart → · End-of-day delayed data
Options (education only)
No strikes or expiries — a framework for how traders might express the view. Options can expire worthless.
Beginners should skip options entirely here and focus on reviewing their basic cash savings and stock index holdings.
See options-friendly brokers →Income / OppHub America angle
Not a trade tip — ways to use the insight outside the market.
- Rebalancing personal cash savings yields against shifting multi-asset model benchmarks
What would break this thesis
- A decisive monthly close of the S&P 500 below its 10-month and 12-month moving average floors
What to do next on OppHub America
Saved playbooks stay on this device for now.
Important
Not financial advice. OppHub America playbooks are educational market maps only — not recommendations to buy, sell, or hold any security. Markets move fast; information can be wrong or outdated. Trade and invest at your own risk. Do your own research or consult a licensed advisor.
Based on reporting from seeking-alpha.
Informational and educational only — not investment, financial, or legal advice. Disclosure
Shares a vertical MP4 loop to your phone's camera roll or app share sheet (Instagram, TikTok, Facebook Reels).