OppHub America Desk · · Source: yahoo-tickers-tape-movers
S&P 500 Falls 4.36% From Near Record: Historical Parallels
Market volatility creates shifting entry points across major equity indices; monitor broader liquidity conditions and risk parameters without forcing directional exposure.
Based on reporting from yahoo-tickers-tape-movers.
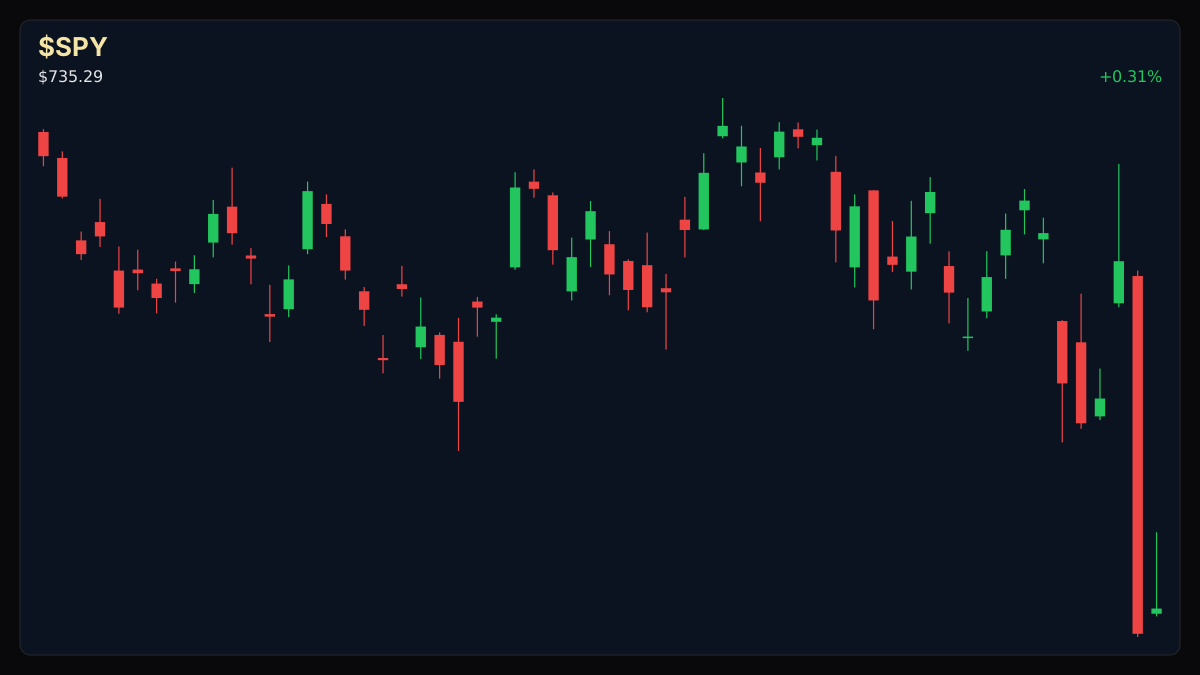
The S&P 500 tumbled 4.36% on Thursday, November 5, 2026, marking its steepest single-session pullback since April 4, 2025, when losses neared 6%. As markets navigate extreme volatility near record highs, historical analogues from prior major drops offer context on subsequent multi-month performance horizons.
Market context for this story
As of: After HoursLoading quotes…
Informational only — not investment advice. Full markets →

$SPYSPDR S&P 500 ETF
TradingView
Live chart & market data via TradingView · OppHub classroom · Delayed or exchange real-time per TradingView data agreements · Not investment advice
Educational TradingView chart — search any symbol in the widget. Confirm on /markets/SPY. Not investment advice.
Related markets
Shares a vertical MP4 loop to your phone's camera roll or app share sheet (Instagram, TikTok, Facebook Reels).
### Session Tape — S&P 500 Index Pullback The S&P 500 closed down following a sharp 4.36% single-session retreat on Thursday, November 5, 2026, dropping from less than 2% away from its October 6 record close. The move represented the index's largest single-day decline since April 4, 2025.
## Catalyst Analysis: Broad Market Selloff and Historical Precedents Market breadth reflected broad-based risk reduction as two negative semiconductor reports and tightening financing conditions weighed on equities. The Philadelphia Semiconductor Index tumbled approximately 12% during the session.
Historical records highlight that steep single-day drops originating near record highs have occurred under various macroeconomic backdrops. For instance, following similar prior market drops, subsequent performance showed mixed multi-month trajectories, with historical indexes recording varied returns across three-month, six-month, and one-year intervals.
## Technical Context and Historical Volatility Thursday's decline pushed indices below key short-term moving averages as participants reassessed equity valuations. Historical analogs indicate that while short-term recovery timelines vary significantly depending on macroeconomic catalysts, broader market drawdowns often test key psychological and technical supports across major asset classes.
Read the full story
Original reporting and related coverage — attribution links only, not paid recommendations.
Trade this story
 Robinhood
 Webull
 Tradier
 IBKR
Chart this story
 TradingView
Broker and exchange buttons use invite / refer-a-friend links (rewards may be capped). Charting links (TradingView) are partner offers that may pay OppHub America a commission at no extra cost to you.
OppSHOP
Full OppSHOP →As an Amazon Associate, OppHub America earns from qualifying purchases. Shopping here helps keep the site free — at no extra cost to you. Disclosure

OppSHOP
Related to this story
Market volatility creates shifting entry points across major equity indi
Shop related →

Investing books
Read the classics
Shop this pick →

Personal finance books
Run the household books
Shop this pick →

Trading notebooks
Write the thesis first
Shop this pick →

Monitor for charts
See every pane
Shop this pick →
Based on reporting from yahoo-tickers-tape-movers.
Informational and educational only — not investment, financial, or legal advice. Disclosure
Shares a vertical MP4 loop to your phone's camera roll or app share sheet (Instagram, TikTok, Facebook Reels).