Barry, OppHub America Desk · · Source: yahoo-tickers-tape-movers
S&P 500 Historical Midterm Returns: What the Data Shows for Stocks
Chips & export controls: Export controls and industrial policy are direct semis catalysts.
Based on reporting from yahoo-tickers-tape-movers.
As markets navigate inflation and tech sector pullbacks, historical data for the S&P 500 reveals a resilient pattern following midterm elections. Investors examining seasonal equity trends can evaluate historical performance metrics as broader volatility persists.
Market context for this story
As of: WeekendLoading quotes…
Informational only — not investment advice. Full markets →

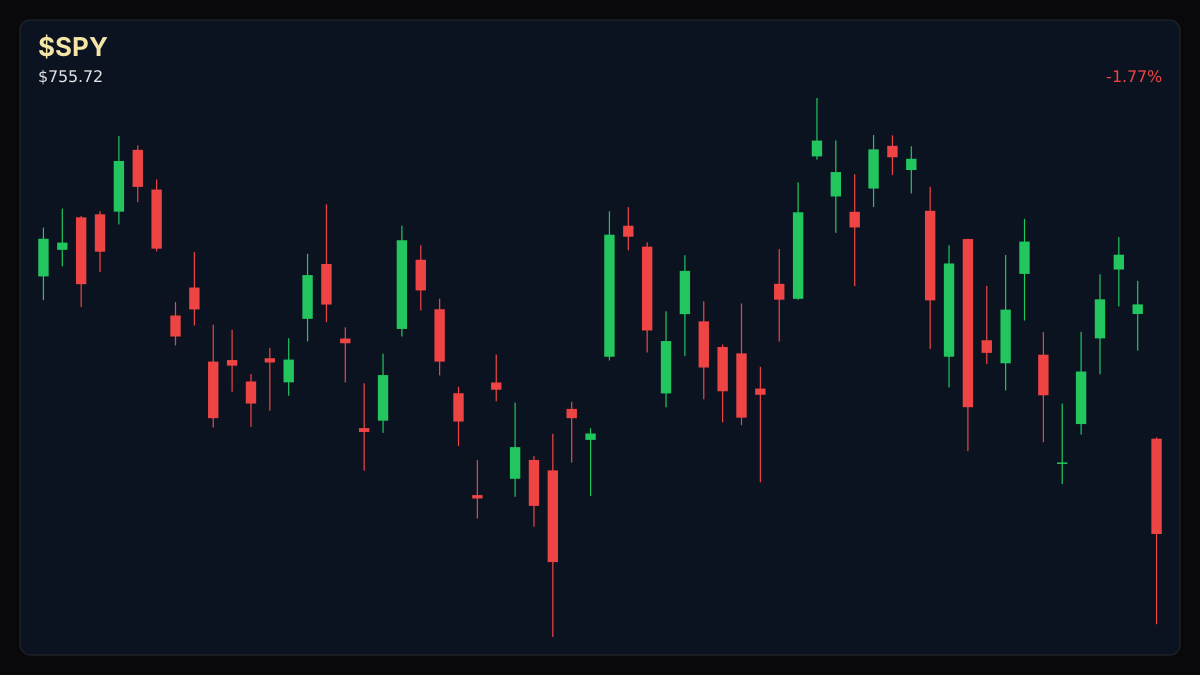
$SPYSPDR S&P 500 ETF
TradingView
Live chart & market data via TradingView · OppHub classroom · Delayed or exchange real-time per TradingView data agreements · Not investment advice
Educational TradingView chart — search any symbol in the widget. Confirm on /markets/SPY. Not investment advice.
Related markets
Shares a vertical MP4 loop to your phone's camera roll or app share sheet (Instagram, TikTok, Facebook Reels).
### Session Tape - S&P 500 (^GSPC): 7,580.07 (-1.82%) - Dow Jones Industrial Average (DJI): 51,770.31 (-1.1%) - Nasdaq Composite: 25,437.00 (-2.9%) - Bitcoin: $77,701.00 (+0.3%)
## Catalyst Analysis: Seasonal Returns and Midterm History Recent pressure across large-cap technology and semiconductor equities, compounded by higher interest rates and ongoing macroeconomic tensions, has prompted a broader review of market positioning. Historical S&P 500 performance surrounding midterm election cycles offers a quantitative lens on these cyclical pullbacks.
According to historical market figures, subsequent one-year returns following midterm elections have demonstrated significant positive tendency, with average gains reaching 16.6% and a median return of 16.3%. Historical observations show that returns over this timeframe remained positive in past cycles, with extremes ranging from a low of 3% in 2014 to a high of 33.6% in 1954. Shorter-term horizons following midterms also reflect historical resilience, averaging 3.6% with a median of 3.2%, though individual cycle drawdowns—such as a 7.6% decline in 2018—underscore ongoing volatility risks for active portfolios.
## Technical Context and Market Overview Broader index levels face pressure amid shifting yields and sector-specific liquidations. Market participants tracking macroeconomic indicators continue to weigh valuation adjustments across major technology constituents against historical cyclical patterns.
Read the full story
Original reporting and related coverage — attribution links only, not paid recommendations.
Trade this story
 Robinhood
 Webull
 Tradier
 IBKR
Chart this story
 TradingView
Broker and exchange buttons use invite / refer-a-friend links (rewards may be capped). Charting links (TradingView) are partner offers that may pay OppHub America a commission at no extra cost to you.
OppSHOP
Full OppSHOP →As an Amazon Associate, OppHub America earns from qualifying purchases. Shopping here helps keep the site free — at no extra cost to you. Disclosure

OppSHOP
Related to this story
Chips & export controls: Export controls and industrial policy are direc
Shop related →

Investing books
Read the classics
Shop this pick →

Personal finance books
Run the household books
Shop this pick →

Trading notebooks
Write the thesis first
Shop this pick →

Monitor for charts
See every pane
Shop this pick →
Story playbook
A pre-built map of what to watch — stocks, ETFs, and educational next steps. Not personalized advice.
Snapshot date: November 1, 2026 at 7:31 AM ET
This playbook was built when the story published and is not live-updated. Prices, news, and risk can change after this date — treat it as a starting map, not a current trade ticket.
Story → money map
Midterm seasonal trends and tech selloff
Historical stock market data shows that the S&P 500 tends to perform very well in the year following midterm elections, even when the market feels bumpy right now. Investors care about this because past patterns suggest current tech stock pullbacks might lead to strong future gains.
What changed
Broad market pullbacks in tech and semis contrast with historical data showing strong positive S&P 500 returns after midterm elections.
Who wins / who loses
Diversified index investors and broad market ETFs benefit from historical rebound trends, while concentrated high-beta tech and semiconductor stocks suffer from near-term volatility and export controls.
Time horizon
Think in terms of the next few months.
Confidence & best fit
medium confidence · Long-term investor
Safer theme exposure (ETFs)
Baskets that own the theme without betting on one company.
Single stocks (higher risk)
Primary = closest to the story · Peers = same industry · Second-order = knock-on effects · Avoid = looks related but may be a trap
Primary
- $GSPCBuild slowly — only if it fits your plan
The overall stock market tends to go up significantly a year after midterm elections.
View $GSPC chart → · End-of-day delayed data
Peer
- $QQQWatch — track, don’t rush
Tech stocks are feeling the heat right now from higher interest rates and rules on chips.
View $QQQ chart → · End-of-day delayed data
Options (education only)
No strikes or expiries — a framework for how traders might express the view. Options can expire worthless.
Beginners should skip options here and simply stick to broad index funds if they want to bet on historical market rebounds.
See options-friendly brokers →Income / OppHub America angle
Not a trade tip — ways to use the insight outside the market.
- Review retirement portfolios for automated dollar-cost averaging into broad index funds during seasonal volatility.
What would break this thesis
- Persistent inflation spikes forcing aggressive Federal Reserve rate hikes beyond expectations, or severe geopolitical disruptions invalidating historical seasonal patterns.
What to do next on OppHub America
Saved playbooks stay on this device for now.
Important
Not financial advice. OppHub America playbooks are educational market maps only — not recommendations to buy, sell, or hold any security. Markets move fast; information can be wrong or outdated. Trade and invest at your own risk. Do your own research or consult a licensed advisor.
Based on reporting from yahoo-tickers-tape-movers.
Informational and educational only — not investment, financial, or legal advice. Disclosure
Shares a vertical MP4 loop to your phone's camera roll or app share sheet (Instagram, TikTok, Facebook Reels).