Barry, OppHub America Desk · · Source: yahoo-tickers-rotation
S&P 500 Rises 0.58% as Dividend Income Strategies Focus on Yield
Monitor broad index vehicles like and to gauge underlying market breadth and risk sentiment when structuring long-term dividend income portfolios.
Based on reporting from yahoo-tickers-rotation.
Generating $6,750 a month in dividend income requires roughly $2.52 million across six holdings at a blended yield of 3.2% as of October 2026. Investors evaluating income generation must weigh these capital requirements against prevailing Treasury yields without falling for yield traps.
Market context for this story
As of: WeekendLoading quotes…
Informational only — not investment advice. Full markets →


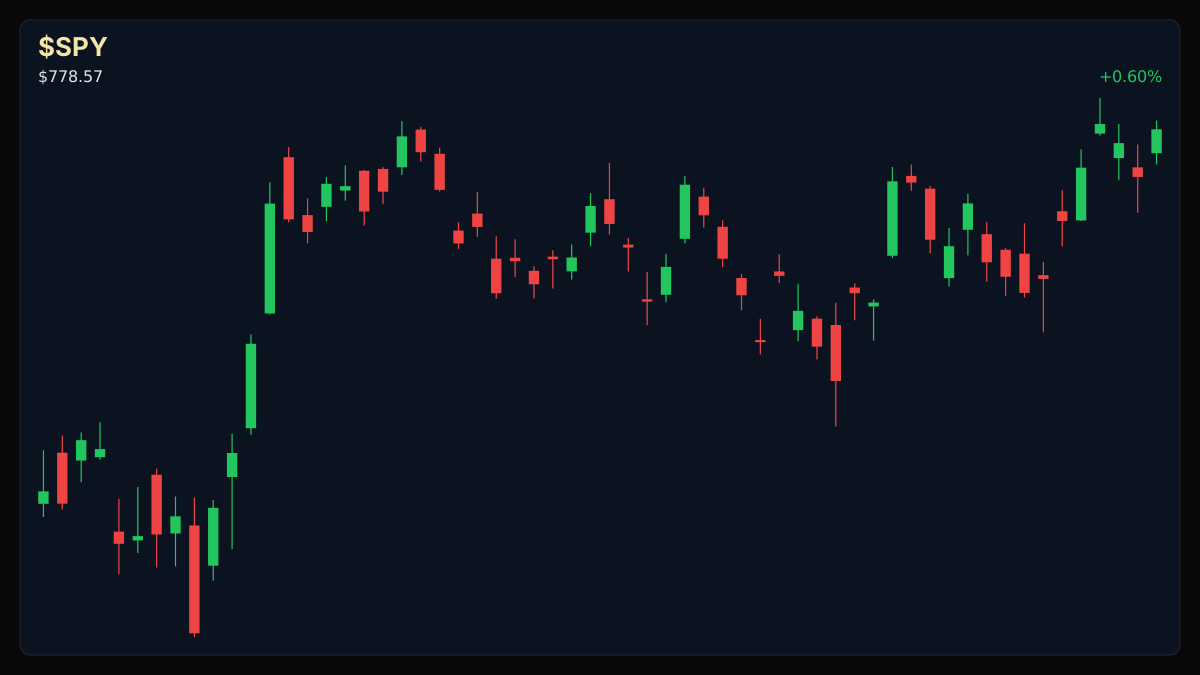
$SPYSPDR S&P 500 ETF
TradingView
Live chart & market data via TradingView · OppHub classroom · Delayed or exchange real-time per TradingView data agreements · Not investment advice
Educational TradingView chart — search any symbol in the widget. Confirm on /markets/SPY and related $IWM. Not investment advice.
Related markets
Shares a vertical MP4 loop to your phone's camera roll or app share sheet (Instagram, TikTok, Facebook Reels).
### Tape / Session Read At the close during the second week of October 2026, the S&P 500 settled at 7,823.60, up 0.58%. Meanwhile, the Dow Jones Industrial Average rose 0.91% to 51,740.80, the Nasdaq 100 gained 0.38% to 30,928.20, and the Russell 2000 advanced 0.43% to 2,809.13. Against this broad market tape, private wealth planning continues to emphasize dividend durability over high headline yields.
### Why This Lane Matters Income-focused investors navigating current equity valuations must balance capital deployment against fixed-income alternatives like the 10-year Treasury yielding 5.2%. A blended equity dividend yield of 3.2% relies heavily on consistent dividend growth rather than immediate yield matching to compete with sovereign debt.
### Money Play Income portfolios targeting consistent monthly cash flow demand careful asset selection across diversified dividend payers and growth ETFs such as $SPY+WL or $IWM+WL benchmarks.
## $SPY+WL Technical Analysis & Key Risk Watch — LIVE MARKET CONTEXT for the lane ETF only Key levels for $SPY+WL (educational): R2 $781.62 · R1 $778.80 · last $777.22 · S1 $775.43 · S2 $772.51. Traders tracking broad market exposure should monitor these boundaries alongside the 50-day moving average at $765.95 and the 200-day moving average at $721.99.
Read the full story
Original reporting and related coverage — attribution links only, not paid recommendations.
Trade this story
 Robinhood
 Webull
 Tradier
 IBKR
IBKR
Chart this story
 TradingView
Broker and exchange buttons use invite / refer-a-friend links (rewards may be capped). Charting links (TradingView) are partner offers that may pay OppHub America a commission at no extra cost to you.
OppSHOP
Full OppSHOP →As an Amazon Associate, OppHub America earns from qualifying purchases. Shopping here helps keep the site free — at no extra cost to you. Disclosure

OppSHOP
Related to this story
Monitor broad index vehicles like and to gauge underlying market breadth
Shop related →

Investing books
Read the classics
Shop this pick →

Personal finance books
Run the household books
Shop this pick →

Trading notebooks
Write the thesis first
Shop this pick →

Monitor for charts
See every pane
Shop this pick →
Story playbook
A pre-built map of what to watch — stocks, ETFs, and educational next steps. Not personalized advice.
Snapshot date: October 11, 2026 at 3:16 PM ET
This playbook was built when the story published and is not live-updated. Prices, news, and risk can change after this date — treat it as a starting map, not a current trade ticket.
Story → money map
dividend income strategies
The stock market went up slightly while people who live off investments tried to figure out if dividend-paying stocks are still better than safe government bonds. Investors need a lot of money in reliable companies to replace a regular paycheck safely.
What changed
Broad equity indexes edged higher while investors balanced dividend-paying stock strategies against rising Treasury yields.
Who wins / who loses
Diversified index funds and durable dividend payers benefit from steady capital flows, while high-yield single stocks with weak balance sheets risk lagging safer fixed-income alternatives.
Time horizon
Think in terms of the next few months.
Confidence & best fit
medium confidence · Long-term investor, Side income / builder
Safer theme exposure (ETFs)
Baskets that own the theme without betting on one company.
- $SPY — A simple way to buy a basket of top companies instead of guessing individual stocks.
- $IWM — A basket of smaller businesses to help balance out a big-stock portfolio.
- $VIG — A fund that looks specifically for reliable companies that raise their payouts over time.
- $NOBL — A safe-feeling basket of companies that have paid and raised dividends for decades.
Single stocks (higher risk)
Primary = closest to the story · Peers = same industry · Second-order = knock-on effects · Avoid = looks related but may be a trap
Primary
- $SPYWatch — track, don’t rush
Owns the whole stock market so you can easily track large, dividend-paying companies.
View $SPY chart → · End-of-day delayed data
Second-order
- $IWMWatch — track, don’t rush
Tracks smaller companies, useful for building a well-rounded portfolio.
View $IWM chart → · End-of-day delayed data
Options (education only)
No strikes or expiries — a framework for how traders might express the view. Options can expire worthless.
Direction: range · Style: Covered-call income (only if you already own shares) · Level: intermediate
Beginners should skip options; you can generate extra cash by selling the right to buy your shares, but it caps your upside.
Income / OppHub America angle
Not a trade tip — ways to use the insight outside the market.
- Compare equity dividend yields against high-yield savings accounts and 10-year Treasuries yielding 5.2%.
What would break this thesis
- Sharp spikes in Treasury yields making fixed income dramatically more attractive than equities.
- Widespread dividend cuts across major large-cap benchmarks.
What to do next on OppHub America
Saved playbooks stay on this device for now.
Important
Not financial advice. OppHub America playbooks are educational market maps only — not recommendations to buy, sell, or hold any security. Markets move fast; information can be wrong or outdated. Trade and invest at your own risk. Do your own research or consult a licensed advisor.
Based on reporting from yahoo-tickers-rotation.
Informational and educational only — not investment, financial, or legal advice. Disclosure
Shares a vertical MP4 loop to your phone's camera roll or app share sheet (Instagram, TikTok, Facebook Reels).