OppHub America Desk · · Source: yahoo-tickers-tape-movers
S&P 500 Rises As Earnings Growth Projections Approach 30-Year Low Valuation Metrics
Broad equity index performance reflects ongoing corporate earnings growth projections for the current calendar year.
Based on reporting from yahoo-tickers-tape-movers.
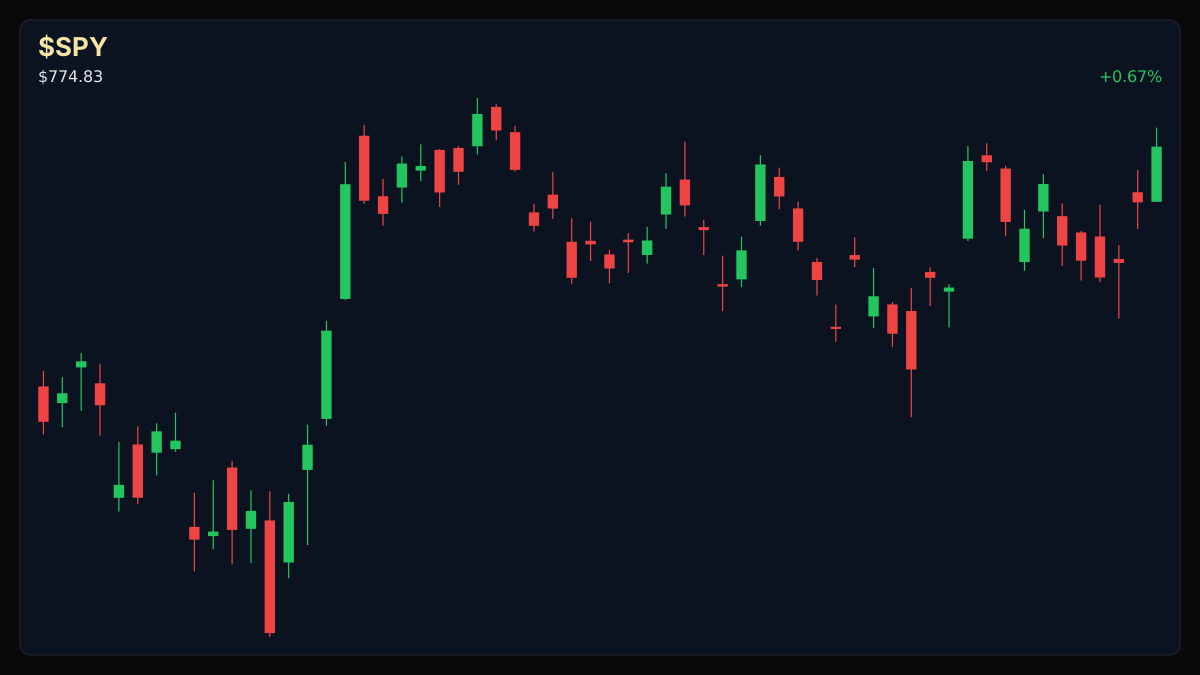
U.S. equities advanced Monday, October 5, 2026, as broader market indexes gained amid forward earnings projections pointing toward sustained double-digit growth. The S&P 500 closed higher by 0.66% at 7,773.95 as analysts look toward upcoming third-quarter corporate reports.
Market context for this story
As of: After HoursLoading quotes…
Informational only — not investment advice. Full markets →
 SPDR S&P 500 ETF·$SPY
$SPYSPDR S&P 500 ETF
TradingView
Live chart & market data via TradingView · OppHub classroom · Delayed or exchange real-time per TradingView data agreements · Not investment advice
Educational TradingView chart — search any symbol in the widget. Confirm on /markets/SPY. Not investment advice.
Related markets
Shares a vertical MP4 loop to your phone's camera roll or app share sheet (Instagram, TikTok, Facebook Reels).
### Tape / Session Read U.S. markets finished the Monday, October 5, 2026 session with positive momentum across major benchmarks. The S&P 500 rose 51.23 points, or 0.66%, to close at 7,773.95. The Dow Jones Industrial Average added 90.94 points, or 0.18%, ending at 51,267.90, while the Nasdaq Composite advanced 286.45 points, or 1.05%, to 27,477.31. The Russell 2000 increased 14.24 points, or 0.50%, to 2,847.14. Meanwhile, the 10-year Treasury bond yield moved up 0.03 to 5.31 (+0.64%), and the Cboe Volatility Index (VIX) gained 0.22 to 15.53 (+1.44%).
### Why This Lane Matters Forward earnings projections underscore ongoing corporate resilience, with consensus expectations pointing to year-over-year earnings growth of 29.5% for the third quarter. FactSet data indicates this streak would mark consecutive quarters of earnings expansion above 25%, while full-year 2026 forecasts project 32.4% growth. Such fundamental data points help frame valuation discussions for institutional participants evaluating index positioning against prevailing interest rate levels.
### Money Play Market participants tracking broader index performance note that steady earnings expansion trajectories influence sector allocation decisions across technology and cyclical assets without relying on single-name catalysts.
Read the full story
Original reporting and related coverage — attribution links only, not paid recommendations.
Trade this story
 Robinhood
 Webull
 Tradier
 IBKR
IBKR
Chart this story
 TradingView
Broker and exchange buttons use invite / refer-a-friend links (rewards may be capped). Charting links (TradingView) are partner offers that may pay OppHub America a commission at no extra cost to you.
OppSHOP
Full OppSHOP →As an Amazon Associate, OppHub America earns from qualifying purchases. Shopping here helps keep the site free — at no extra cost to you. Disclosure

OppSHOP
Related to this story
Broad equity index performance reflects ongoing corporate earnings growt
Shop related →

Investing books
Read the classics
Shop this pick →

Personal finance books
Run the household books
Shop this pick →

Trading notebooks
Write the thesis first
Shop this pick →

Monitor for charts
See every pane
Shop this pick →
Aftermath · $NVDA
+5.07% vs write
- •Since this piece: $NVDA is up +5.07% vs $227.38 at write time (now $238.90).
- •Session move (Yahoo delayed): +2.12%.
- •RSI14 at write was 56.3 — compare levels on Markets, not advice.
- •Original money play lens: Broad equity index performance reflects ongoing corporate earnings growth projections for the current calendar year.
- •Track $NVDA live on OppHub Markets (/markets/NVDA). Not financial advice.
Based on reporting from yahoo-tickers-tape-movers.
Informational and educational only — not investment, financial, or legal advice. Disclosure
Shares a vertical MP4 loop to your phone's camera roll or app share sheet (Instagram, TikTok, Facebook Reels).