OppHub America Desk · · Source: yahoo-tickers-tape-movers
S&P 500 Slides 1.96% as VIX Spikes 12.24% Amid Broad Market Retreat
Market breadth reflects a broad risk-off environment across equities and risk assets.
Based on reporting from yahoo-tickers-tape-movers.
U.S. equities pulled back sharply on Friday, November 20, 2026, as major tape indices sank led by a 3.28% drop in the Nasdaq and a 12.24% surge in the VIX. Investors weighed a broad-based risk-off session across equities, commodities, and digital assets.
Market context for this story
As of: Regular HoursLoading quotes…
Informational only — not investment advice. Full markets →


$SPYSPDR S&P 500 ETF
TradingView
Live chart & market data via TradingView · OppHub classroom · Delayed or exchange real-time per TradingView data agreements · Not investment advice
$BNYBNY Mellon
TradingView
Live chart & market data via TradingView · OppHub classroom · Delayed or exchange real-time per TradingView data agreements · Not investment advice
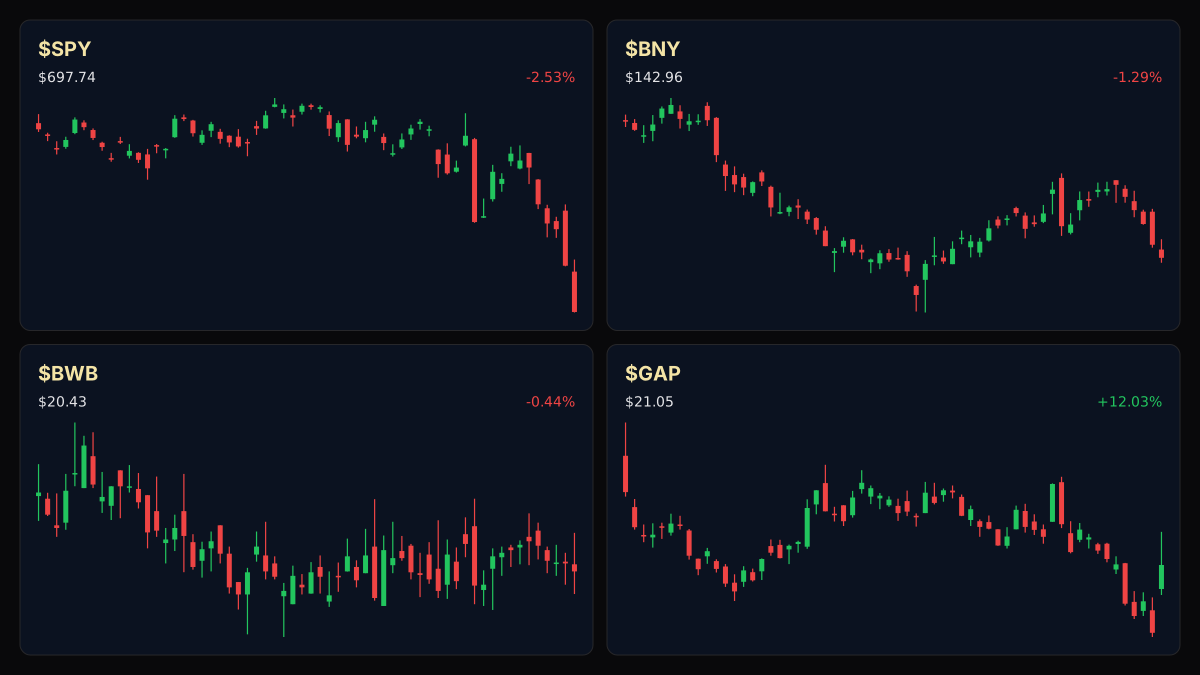
Educational TradingView charts — search any symbol in the widget. Confirm on /markets/SPY and related $BNY, $BWB, $GAP. Not investment advice.
Related markets
Shares a vertical MP4 loop to your phone's camera roll or app share sheet (Instagram, TikTok, Facebook Reels).
### Tape / Session Read During the regular trading session on Friday, November 20, 2026, major U.S. benchmarks faced heavy selling pressure. The S&P 500 dropped 140.32 points, or 1.96%, to close at 7,035.51, while the Dow Jones Industrial Average slid 240.71 points, or 0.49%, to 48,856.35. The Nasdaq Composite retreated 783.33 points, or 3.28%, to finish at 23,095.87, and the Russell 2000 gave up 46.14 points, or 1.74%, ending at 2,608.97. Volatility spiked sharply as the Cboe Volatility Index (VIX) jumped 3.49 points, or 12.24%, to 31.93. Fixed income and commodities also saw notable movement, with the 10-year Treasury yield easing 0.1120 points, or 2.22%, to 4.9400, gold falling 176.90, or 4.80%, to 3,508.60, and Bitcoin dropping 4,514.28, or 7.19%, to 58,296.35.
### Why This Lane Matters The sharp contraction across the major indices signals a decisive risk-off rotation as equity market breadth deteriorated. The combination of a surging VIX and steep declines in high-beta sectors highlights a flight from risk assets, impacting broader portfolio allocations and margin conditions across institutional desks.
## Market Technical Analysis & Key Risk Watch
77.54 · R1 ## Market Technical Analysis & Key Risk Watch 63.20 · last ## Market Technical Analysis & Key Risk Watch 56.14 · S1 ## Market Technical Analysis & Key Risk Watch 55.01 · S2 ## Market Technical Analysis & Key Risk Watch 48.80.
With the VIX climbing above 31 and broad market indices testing lower technical boundaries, traders are closely monitoring key support levels across benchmark exchange-traded products to gauge whether institutional buyers will step in or if profit-taking and deleveraging will extend the drawdown.
Read the full story
Original reporting and related coverage — attribution links only, not paid recommendations.
Trade this story (crypto)
 Coinbase
 Gemini
 Robinhood
 Webull
Chart this story
 TradingView
Broker and exchange buttons use invite / refer-a-friend links (rewards may be capped). Charting links (TradingView) are partner offers that may pay OppHub America a commission at no extra cost to you.
OppSHOP
Full OppSHOP →As an Amazon Associate, OppHub America earns from qualifying purchases. Shopping here helps keep the site free — at no extra cost to you. Disclosure

OppSHOP
Related to this story
Market breadth reflects a broad risk-off environment across equities and
Shop related →

Investing books
Read the classics
Shop this pick →

Personal finance books
Run the household books
Shop this pick →

Trading notebooks
Write the thesis first
Shop this pick →

Monitor for charts
See every pane
Shop this pick →
Based on reporting from yahoo-tickers-tape-movers.
Informational and educational only — not investment, financial, or legal advice. Disclosure
Shares a vertical MP4 loop to your phone's camera roll or app share sheet (Instagram, TikTok, Facebook Reels).