Barry, OppHub America Desk · · Source: yahoo-tickers-tape-movers
SPY At Record Highs While Stealth Bear Market Grips Equities
If index concentration persists while broader participation deteriorates, watch because divergence between cap-weighted benchmarks and equal-weight metrics can trigger sharp sector rotation and volatility adjustments.
Based on reporting from yahoo-tickers-tape-movers.
The S&P 500 sits near record highs on Wednesday, October 14, 2026, even as broader market internals signal that over half of U.S. equities sit down more than twenty percent from their peaks. Traders tracking $SPY+WL navigate a bifurcated tape where megacap concentration masks underlying breadth erosion.
Market context for this story
As of: PremarketLoading quotes…
Informational only — not investment advice. Full markets →


$SPYSPDR S&P 500 ETF
TradingView
Live chart & market data via TradingView · OppHub classroom · Delayed or exchange real-time per TradingView data agreements · Not investment advice
$META
TradingView
Live chart & market data via TradingView · OppHub classroom · Delayed or exchange real-time per TradingView data agreements · Not investment advice
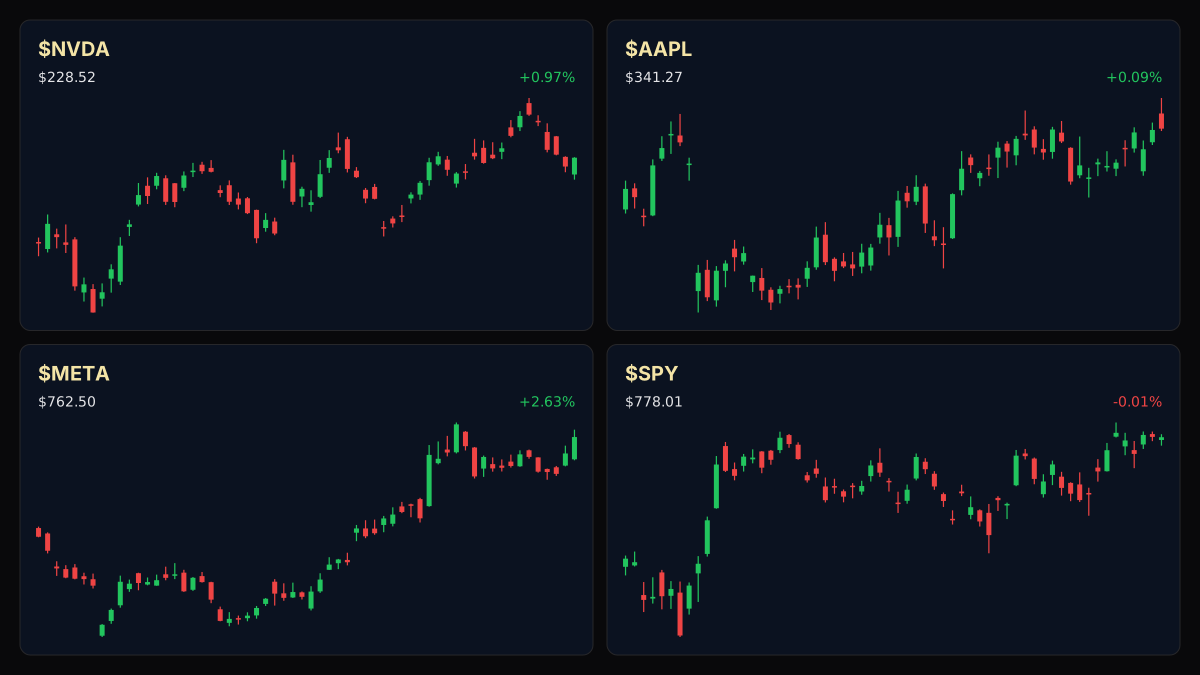
Educational TradingView charts — search any symbol in the widget. Confirm on /markets/SPY and related $META, $AAPL, $NVDA. Not investment advice.
Related markets
Shares a vertical MP4 loop to your phone's camera roll or app share sheet (Instagram, TikTok, Facebook Reels).
### Tape / Session Read At close, the S&P 500 traded at 7,831.60, up 0.20%, while the Dow Jones finished at 51,936.70, higher by 0.43%. The Nasdaq 100 closed at 30,598.60, gaining 0.02%, and the Russell 2000 reached 2,796.90, advancing 0.33%. Capital Blueprint reports that the S&P 500 rests approximately 0.1% below its record set on Tuesday, October 6, 2026.
### Why This Lane Matters Index-level resilience driven by a handful of large-cap constituents can obscure severe drawdowns across secondary equities. Market participants monitoring must assess whether narrow leadership can continue to sustain capitalization-weighted benchmarks while equal-weight measures and semiconductor components face deeper corrections.
### Money Play If index concentration persists while broader participation deteriorates, watch because divergence between cap-weighted benchmarks and equal-weight metrics can trigger sharp sector rotation and volatility adjustments.
### Related Names
## Technical Analysis & Key Risk Watch — LIVE MARKET CONTEXT for the lane ETF only
Broad equity benchmarks maintain elevated valuations while underlying sector breadth shows significant divergence. Traders tracking the S&P 500 should monitor equal-weight drawdown ratios, bond volatility, and momentum indicators to gauge index stability.
### Story Arc / How We Got Here
This follows our earlier coverage ([Amazon Stock Rises 1.95% As Market Participants Track Estimates](/explore/amazon-stock-rises-195-as-market-participants-track-estimates)) on 2026-10-06. Amazon.com (NASDAQ: AMZN) closed a recent trading session up 1.95% at $256.29, outperforming broad retail sector losses as investors analyze upcoming quarterly consensus estimates. Traders are tracking projected earnings of $2.02 per share alongside expected net sales of $202.01 billion. · If Amazon.com holds session gains near $256.29 ahead of consensus reporting dates, watch options volatility and near-term execution flow because retail sector relative strength could trigger institutional rebalancing.
Read the full story
Original reporting and related coverage — attribution links only, not paid recommendations.
Trade this story
 Robinhood
 Webull
 Tradier
 IBKR
IBKR
Chart this story
 TradingView
Broker and exchange buttons use invite / refer-a-friend links (rewards may be capped). Charting links (TradingView) are partner offers that may pay OppHub America a commission at no extra cost to you.
OppSHOP
Full OppSHOP →As an Amazon Associate, OppHub America earns from qualifying purchases. Shopping here helps keep the site free — at no extra cost to you. Disclosure

OppSHOP
Related to this story
If index concentration persists while broader participation deteriorates
Shop related →

Investing books
Read the classics
Shop this pick →

Personal finance books
Run the household books
Shop this pick →

Trading notebooks
Write the thesis first
Shop this pick →

Monitor for charts
See every pane
Shop this pick →
Story playbook
A pre-built map of what to watch — stocks, ETFs, and educational next steps. Not personalized advice.
Snapshot date: October 14, 2026 at 5:31 AM ET
This playbook was built when the story published and is not live-updated. Prices, news, and risk can change after this date — treat it as a starting map, not a current trade ticket.
Story → money map
market breadth divergence
The main stock market index looks healthy because a few giant companies are doing very well, even though most other stocks are actually falling. Investors care because this hidden weakness can cause sudden market drops when people least expect it.
What changed
Cap-weighted indexes sit near record highs while broad market internals show over half of U.S. equities down more than twenty percent.
Who wins / who loses
Mega-cap index constituents benefit from concentrated inflows, while equal-weight constituents and secondary equities suffer stealth bear market drawdowns.
Time horizon
Think in terms of the next few weeks.
Confidence & best fit
medium confidence · Active trader
Safer theme exposure (ETFs)
Baskets that own the theme without betting on one company.
- $RSP — This fund gives equal weight to all stocks in the index rather than just the biggest ones, showing true market health.
- $IWM — This fund focuses on smaller companies, which often feel the squeeze first when market breadth deteriorates.
- $VTI — This fund buys almost every U.S. stock to avoid relying only on a handful of tech giants.
Single stocks (higher risk)
Primary = closest to the story · Peers = same industry · Second-order = knock-on effects · Avoid = looks related but may be a trap
Primary
- $SPYWatch — track, don’t rush
The main market index hides the fact that most individual stocks are dropping.
View $SPY chart → · End-of-day delayed data
Options (education only)
No strikes or expiries — a framework for how traders might express the view. Options can expire worthless.
Direction: volatile · Style: Protective put / downside hedge idea · Level: intermediate
Beginners should skip options here, as buying market insurance puts can lose value quickly if the headline index keeps drifting higher.
Income / OppHub America angle
Not a trade tip — ways to use the insight outside the market.
- Rebalance portfolio allocations away from crowded mega-cap momentum toward equal-weight or defensive sectors.
What would break this thesis
- Broad market participation recovers and equal-weight indexes break out alongside mega-caps.
What to do next on OppHub America
Saved playbooks stay on this device for now.
Important
Not financial advice. OppHub America playbooks are educational market maps only — not recommendations to buy, sell, or hold any security. Markets move fast; information can be wrong or outdated. Trade and invest at your own risk. Do your own research or consult a licensed advisor.
Based on reporting from yahoo-tickers-tape-movers.
Informational and educational only — not investment, financial, or legal advice. Disclosure
Shares a vertical MP4 loop to your phone's camera roll or app share sheet (Instagram, TikTok, Facebook Reels).