Barry, OppHub America Desk · · Source: yahoo-tickers-tape-movers
Stock Market Tape: S&P 500 Moves +0.3% Amid Midterm Historical Context
Housing & mortgages: Rate and housing policy spill into builders, small-caps, and REITs.
Based on reporting from yahoo-tickers-tape-movers.
The S&P 500 recently registered a 0.3% move as investors parse historical market performance following midterm elections. Major benchmarks and select tape leaders showed mixed prints on Saturday, November 7, 2026.
Market context for this story
As of: WeekendLoading quotes…
Informational only — not investment advice. Full markets →
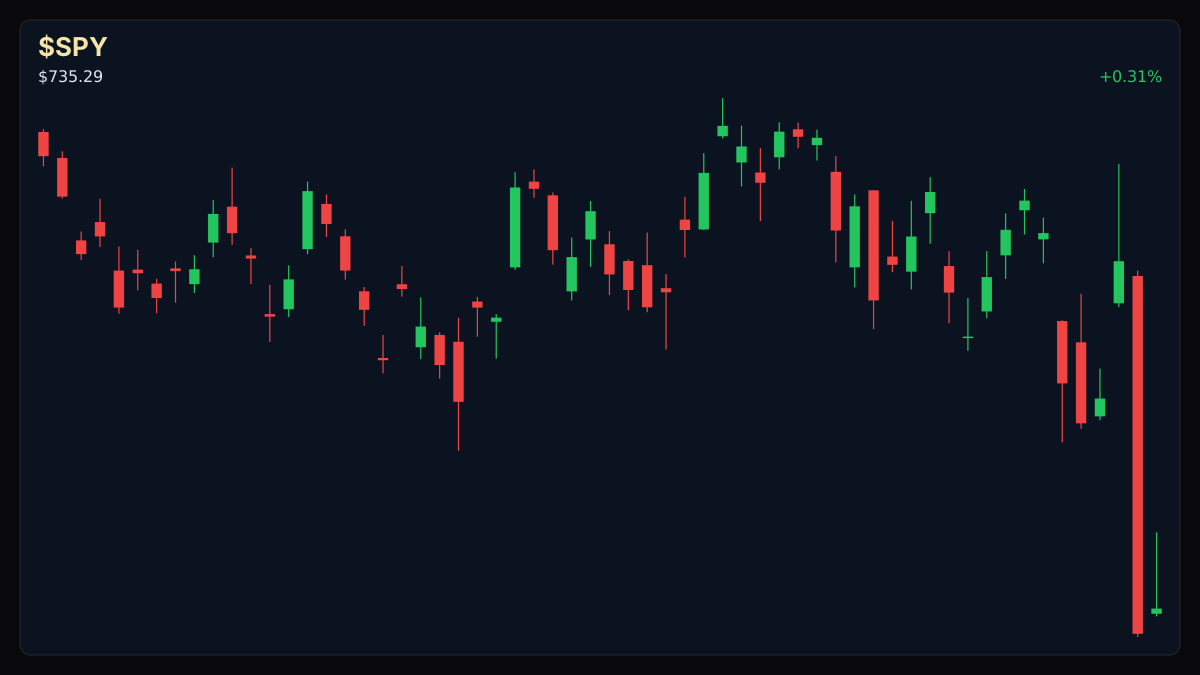
 SPDR S&P 500 ETF·$SPY
$SPYSPDR S&P 500 ETF
TradingView
Live chart & market data via TradingView · OppHub classroom · Delayed or exchange real-time per TradingView data agreements · Not investment advice
Educational TradingView chart — search any symbol in the widget. Confirm on /markets/SPY. Not investment advice.
Related markets
Shares a vertical MP4 loop to your phone's camera roll or app share sheet (Instagram, TikTok, Facebook Reels).
### Session Tape — S&P 500 +0.3%, Dow -0.5%, Nasdaq +1.1%
## Catalyst Analysis: Historical Midterm Dynamics and Tape Action
Recent tape activity highlights mixed movement across major indices alongside historical analyses regarding midterm election cycles. The S&P 500 recorded a 0.3% change to 7,376.86, while the Dow Jones Industrial Average moved down 0.5% to 51,285.73. Meanwhile, the Nasdaq Composite advanced 1.1% to reach 24,579.42.
Historical reference points indicate varying performance structures during political cycles. Previous periods show distinct average returns depending on executive and congressional alignment, though current market conditions reflect immediate tape pricing rather than deterministic outcomes. Bitcoin traded near $75,908.00 down 0.3%, while individual equities registered varied session prints.
## Impact on Tickers Mentioned
No specific primary tickers were isolated as fundamental catalysts in the session feed, as the tape reflects broader index and macro sentiment shifts. Market participants continue to evaluate sector breadth relative to historical benchmarks.
### Money Play
Read the full story
Original reporting and related coverage — attribution links only, not paid recommendations.
Trade this story
 Robinhood
 Webull
 Tradier
 IBKR
Chart this story
 TradingView
Broker and exchange buttons use invite / refer-a-friend links (rewards may be capped). Charting links (TradingView) are partner offers that may pay OppHub America a commission at no extra cost to you.
OppSHOP
Full OppSHOP →As an Amazon Associate, OppHub America earns from qualifying purchases. Shopping here helps keep the site free — at no extra cost to you. Disclosure

OppSHOP
Related to this story
Housing & mortgages: Rate and housing policy spill into builders, small-
Shop related →

Investing books
Read the classics
Shop this pick →

Personal finance books
Run the household books
Shop this pick →

Trading notebooks
Write the thesis first
Shop this pick →

Monitor for charts
See every pane
Shop this pick →
Story playbook
A pre-built map of what to watch — stocks, ETFs, and educational next steps. Not personalized advice.
Snapshot date: November 7, 2026 at 6:01 AM ET
This playbook was built when the story published and is not live-updated. Prices, news, and risk can change after this date — treat it as a starting map, not a current trade ticket.
Story → money map
midterm market tape and housing rates
The stock market showed mixed results with tech stocks going up while traditional industrial stocks went down. People are looking at past midterm election trends to guess where the economy and housing market might head next.
What changed
Major stock indices showed mixed performance led by a 1.1% gain in the Nasdaq alongside historical midterm analyses.
Who wins / who loses
Tech-heavy growth stocks benefit from current momentum, while traditional industrial and housing-related sectors face mixed tape pressure.
Time horizon
Think in terms of the next few weeks.
Confidence & best fit
low confidence · Long-term investor
Low confidence → prefer ETFs and “Watch,” not rushing into one stock.
Safer theme exposure (ETFs)
Baskets that own the theme without betting on one company.
Single stocks (higher risk)
Primary = closest to the story · Peers = same industry · Second-order = knock-on effects · Avoid = looks related but may be a trap
Primary
- $ITBWatch — track, don’t rush
Tracks home builders, which are sensitive to mortgage rates and housing policy mentioned in the news.
View $ITB chart → · End-of-day delayed data
Peer
- $QQQBuild slowly — only if it fits your plan
A basket of top tech stocks that outperformed the broader market during this session.
View $QQQ chart → · End-of-day delayed data
Second-order
- $DIAWatch — track, don’t rush
Tracks the big traditional companies that lagged behind tech in recent trading.
View $DIA chart → · End-of-day delayed data
Options (education only)
No strikes or expiries — a framework for how traders might express the view. Options can expire worthless.
Beginners should skip options here since the market is moving in mixed directions without a clear trend.
See options-friendly brokers →Income / OppHub America angle
Not a trade tip — ways to use the insight outside the market.
- Monitor local real estate mortgage rates for refinancing opportunities.
What would break this thesis
- A sharp breakdown in major index support levels or unexpected shifts in monetary policy.
What to do next on OppHub America
Saved playbooks stay on this device for now.
Important
Not financial advice. OppHub America playbooks are educational market maps only — not recommendations to buy, sell, or hold any security. Markets move fast; information can be wrong or outdated. Trade and invest at your own risk. Do your own research or consult a licensed advisor.
Based on reporting from yahoo-tickers-tape-movers.
Informational and educational only — not investment, financial, or legal advice. Disclosure
Shares a vertical MP4 loop to your phone's camera roll or app share sheet (Instagram, TikTok, Facebook Reels).