Barry, OppHub America Desk · · Source: yahoo-megacap-tickers
Tesla Q2 Earnings: Revenue Climbs 26%, EPS Declines 18%
Given the mixed financial performance and the absence of specific investable vehicles in the facts, investors should focus on Tesla's operational efficiency and long-term project viability over short-term price movements.
Based on reporting from yahoo-megacap-tickers.
Tesla Inc.'s second-quarter earnings report reveals a 26% year-over-year revenue increase to $28.2 billion, driven by robust delivery growth, yet adjusted earnings per share saw an 18% decline to $0.33, signaling mixed performance for the electric vehicle giant.
Market context for this story
As of: After HoursLoading quotes…
Informational only — not investment advice. Full markets →
 Tesla Inc·$TSLA
$TSLATesla Inc
TradingView
Live chart & market data via TradingView · OppHub classroom · Delayed or exchange real-time per TradingView data agreements · Not investment advice
Educational TradingView chart — search any symbol in the widget. Confirm on /markets/TSLA. Not investment advice.
Related markets
Shares a vertical MP4 loop to your phone's camera roll or app share sheet (Instagram, TikTok, Facebook Reels).
Tesla Inc.'s second-quarter earnings report indicates a 26% year-over-year revenue increase to $28.2 billion, propelled by a 25% surge in deliveries, though adjusted earnings per share saw an 18% decline to $0.33.
### Money Play There are no distinct investable opportunities or tickers mentioned in the provided facts for a specific Money Play beyond Tesla itself. Investors may want to assess Tesla's long-term growth prospects alongside its current financial performance.
## Catalyst Analysis: Mixed Financial Performance - Revenue: Reported $28.2 billion (up 26% YoY) - EPS: Reported $0.33 (down 18% YoY)
Tesla's revenue expansion to $28.2 billion for the second quarter highlights continued strong demand for its electric vehicles, with deliveries increasing by 25% year-over-year to 480,126 units. This top-line growth demonstrates the company's ability to scale its core EV business. Despite this, the adjusted earnings per share falling by 18% to $0.33 suggests margin pressures or increased operational costs, potentially linked to significant capital expenditures for new projects like robotaxis.
The gross margin for the quarter stood at 18.85%. While revenue growth outperforms, the decline in EPS signals that the company's profitability did not keep pace. This divergence indicates that while sales volume is expanding, the company's cost structure or pricing strategies might be impacting its bottom line, a factor that often prompts investor scrutiny.
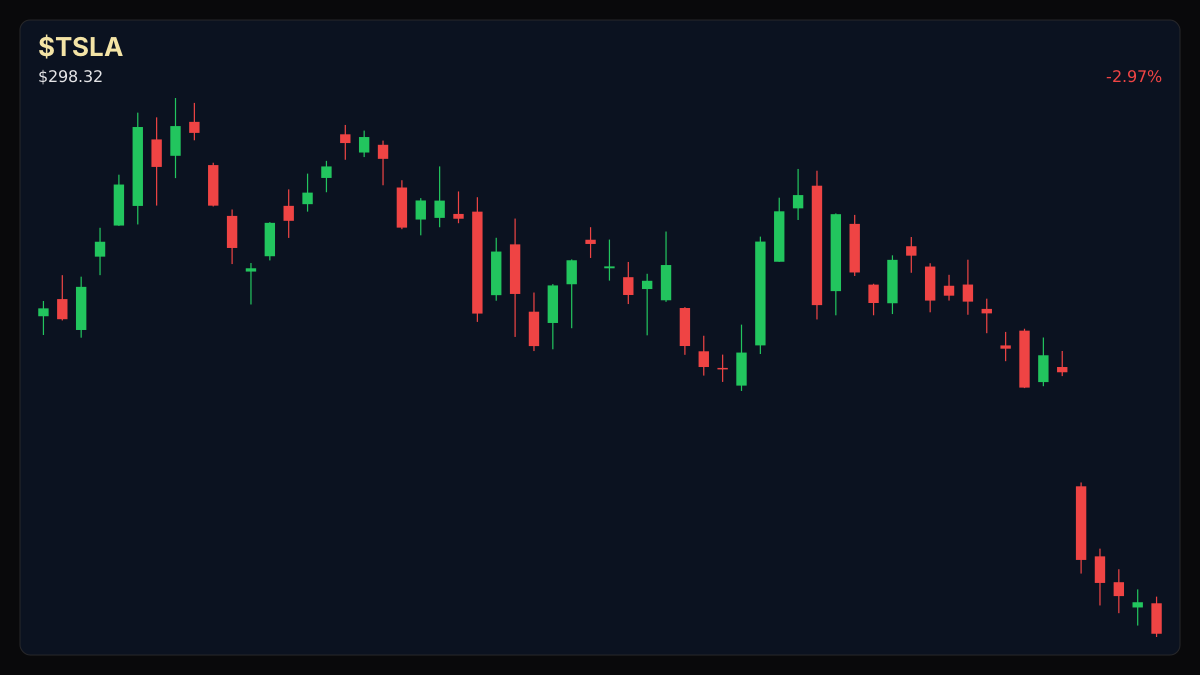
## $TSLA+WL Technical Analysis & Key Risk Watch As of Thursday, July 30, 2026, Tesla Inc. ($TSLA+WL) last traded at $309.22. The stock exhibits a bearish technical stance as it remains below its 50-day Simple Moving Average (SMA50) of $399.84 and its 200-day Simple Moving Average (SMA200) of $414.09. The Relative Strength Index (RSI14) is at 17.2, indicating oversold conditions. Volume for the session was 1.01x its 20-day average.
### Sector Ripple / Impact on Electric Vehicle Sector The mixed results from Tesla, particularly the strong revenue growth coupled with declining EPS, could lead to increased scrutiny on the profitability and capital expenditure strategies across the broader Electric Vehicle (EV) sector. While robust delivery numbers suggest healthy consumer demand, the erosion of adjusted EPS may prompt investors to evaluate the margin sustainability and operational efficiency of other EV manufacturers as well.
Read the full story
Original reporting and related coverage — attribution links only, not paid recommendations.
Trade this story
 Robinhood
 Webull
 Tradier
 IBKR
IBKR
Chart this story
 TradingView
Broker and exchange buttons use invite / refer-a-friend links (rewards may be capped). Charting links (TradingView) are partner offers that may pay OppHub America a commission at no extra cost to you.
OppSHOP
Full OppSHOP →As an Amazon Associate, OppHub America earns from qualifying purchases. Shopping here helps keep the site free — at no extra cost to you. Disclosure

OppSHOP
Related to this story
Given the mixed financial performance and the absence of specific invest
Shop related →

Investing books
Read the classics
Shop this pick →

Personal finance books
Run the household books
Shop this pick →

Trading notebooks
Write the thesis first
Shop this pick →

Monitor for charts
See every pane
Shop this pick →
Story playbook
A pre-built map of what to watch — stocks, ETFs, and educational next steps. Not personalized advice.
Snapshot date: July 30, 2026 at 2:11 AM ET
This playbook was built when the story published and is not live-updated. Prices, news, and risk can change after this date — treat it as a starting map, not a current trade ticket.
Story → money map
electric vehicles
Tesla made a lot more money from selling cars this quarter, but its actual profit per share went down because costs are rising. People who follow money are watching to see if their spending on new projects will pay off later.
What changed
Tesla posted Q2 revenue up 26% year-over-year but EPS dropped 18% due to margin pressure.
Who wins / who loses
EV consumers benefit from strong production scaling, while profit-focused shareholders face margin compression.
Time horizon
Think in terms of the next few months.
Confidence & best fit
medium confidence · Long-term investor
Safer theme exposure (ETFs)
Baskets that own the theme without betting on one company.
- $DRIV — A basket of electric and self-driving car stocks helps you spread out your risk instead of betting on just one company.
- $KARS — An exchange-traded fund focused on the future of driving, letting you invest in the whole industry safely.
Single stocks (higher risk)
Primary = closest to the story · Peers = same industry · Second-order = knock-on effects · Avoid = looks related but may be a trap
Primary
- $TSLAWatch — track, don’t rush
Tesla is selling more cars, but keeping less profit from each sale, so it is best to watch and wait.
View $TSLA chart → · End-of-day delayed data
Peer
- $RIVNStay away — for now
Other electric car companies are dealing with the same high costs and profit challenges.
View $RIVN chart → · End-of-day delayed data
- $FWatch — track, don’t rush
Old-school car companies spending money to build electric vehicles are also seeing squeezed profits.
View $F chart → · End-of-day delayed data
Options (education only)
No strikes or expiries — a framework for how traders might express the view. Options can expire worthless.
Since the stock can swing wildly in either direction after earnings, beginners should completely skip options here.
See options-friendly brokers →Income / OppHub America angle
Not a trade tip — ways to use the insight outside the market.
- Evaluate local EV charging infrastructure stocks or suppliers benefiting from rising delivery volumes.
What would break this thesis
- Sustained gross margin recovery above 20% or sharper-than-expected drops in vehicle delivery numbers.
What to do next on OppHub America
Saved playbooks stay on this device for now.
Important
Not financial advice. OppHub America playbooks are educational market maps only — not recommendations to buy, sell, or hold any security. Markets move fast; information can be wrong or outdated. Trade and invest at your own risk. Do your own research or consult a licensed advisor.
Aftermath · $GOOGL
+0.9% vs write
- •Since this piece: $GOOGL is up +0.9% vs $333.71 at write time (now $336.71).
- •Session move (Yahoo delayed): +0.9%.
- •RSI14 at write was 36.9 — compare levels on Markets, not advice.
- •Original money play lens: Given the mixed financial performance and the absence of specific investable vehicles in the facts, investors should focus on Tesla's operational efficiency and long-term project v
- •Track $GOOGL live on OppHub Markets (/markets/GOOGL). Not financial advice.
Based on reporting from yahoo-megacap-tickers.
Informational and educational only — not investment, financial, or legal advice. Disclosure
Shares a vertical MP4 loop to your phone's camera roll or app share sheet (Instagram, TikTok, Facebook Reels).