Barry, OppHub America Desk · · Source: yahoo-tickers-tape-movers
TSLA Stock Record Drought: Historical Context on 11-Month Highs
If Tesla attempts to close the roughly 41% gap to prior record highs, traders should watch volume participation around key historical resistance zones and prior cycle lows to gauge structural accumulation.
Based on reporting from yahoo-tickers-tape-movers.
Tesla shares (NASDAQ: TSLA) have gone nearly 11 months without closing at a record high, hovering roughly 39% below prior peaks while traders evaluate historical valuation gaps and prior drought breakouts. This analysis examines past dry spells to contextualize current structural positioning.
Market context for this story
As of: WeekendLoading quotes…
Informational only — not investment advice. Full markets →


$TSLAHistorical Record Droughts Tesla
TradingView
Live chart & market data via TradingView · OppHub classroom · Delayed or exchange real-time per TradingView data agreements · Not investment advice
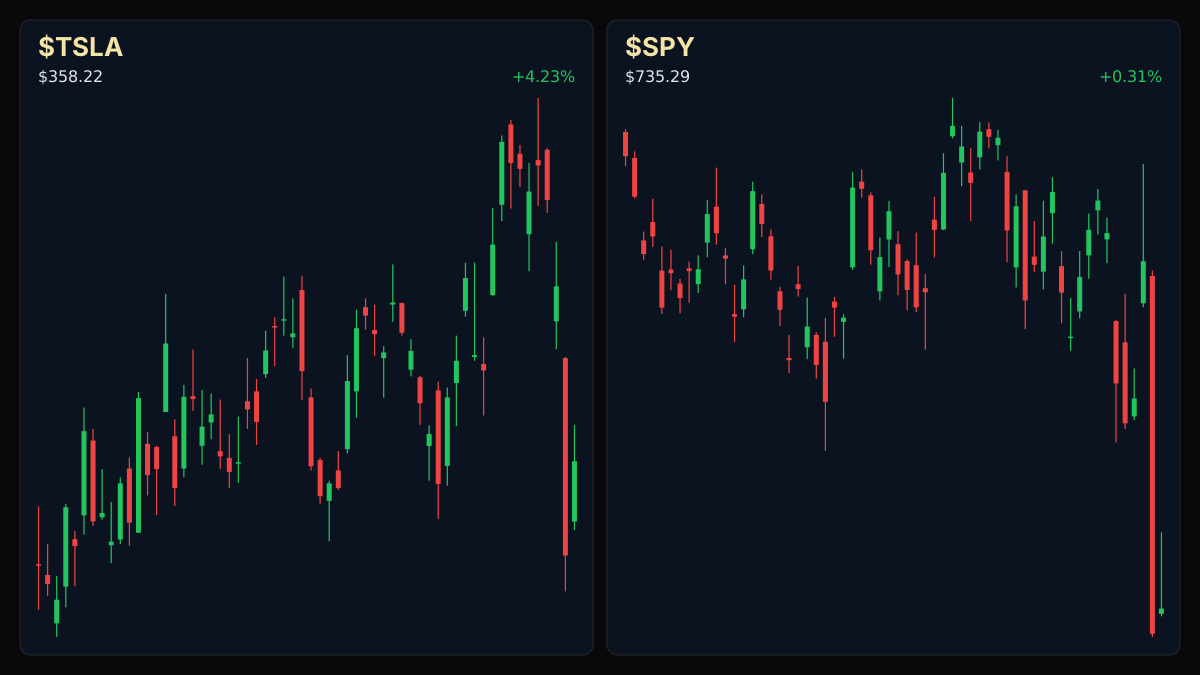
Educational TradingView chart — search any symbol in the widget. Confirm on /markets/TSLA and related $SPY. Not investment advice.
Related markets
Shares a vertical MP4 loop to your phone's camera roll or app share sheet (Instagram, TikTok, Facebook Reels).
### Session Tape — Weekend Positioning - $TSLA+WL: $358.22 (+4.2% session tape move)
## Catalyst Analysis: Historical Record Droughts Tesla ($TSLA+WL) has gone nearly 11 months without a record closing high, with its lowest close during the current stretch reaching $298.32 on July 29, approximately 39% below its December record. Historical precedents show that the electric vehicle maker has experienced six similar prolonged droughts prior to this cycle. Across those historical intervals, subsequent trajectories varied significantly, with prior droughts preceding major percentage rallies or extended consolidations depending on broader macro liquidity and fundamental execution.
## $TSLA+WL Technical Analysis & Key Risk Watch — Tape Context
Traders tracking $TSLA+WL note that the equity closed at a record on Dec. 16 before entering the current consolidation band. Technical risk parameters hinge on whether the security can bridge the roughly 41% deficit required to test prior all-time highs. Given historical analogues where prior lows dipped more than 70% below prior peaks before finding sustained bases, market participants are closely monitoring volume profiles and wider industrial sector breadth.
### Story Arc / How We Got Here This analysis builds upon prior corporate evaluations surrounding Tesla's governance and exploratory structural talks. For background on earlier strategic positioning, review our coverage of the [Tesla merger evaluation and governance focus](/explore/tesla-merger-evaluation-sparks-structural-and-governance-focus).
## Impact on Related Tickers Broader market tape performance reflected mixed breadth, with the S&P 500 up 0.3% to 7,376.86 and the Nasdaq Composite rising 1.1% to 24,579.42, while the Dow Jones Industrial Average dipped 0.5% to 51,285.73. Mega-cap technology equities traded unevenly alongside $TSLA+WL's session bounce, reflecting selective sector rotation rather than uniform directional momentum.
Read the full story
Original reporting and related coverage — attribution links only, not paid recommendations.
Trade this story
 Robinhood
 Webull
 Tradier
 IBKR
Chart this story
 TradingView
Broker and exchange buttons use invite / refer-a-friend links (rewards may be capped). Charting links (TradingView) are partner offers that may pay OppHub America a commission at no extra cost to you.
OppSHOP
Full OppSHOP →As an Amazon Associate, OppHub America earns from qualifying purchases. Shopping here helps keep the site free — at no extra cost to you. Disclosure

OppSHOP
Related to this story
If Tesla attempts to close the roughly 41% gap to prior record highs, tr
Shop related →

Investing books
Read the classics
Shop this pick →

Personal finance books
Run the household books
Shop this pick →

Trading notebooks
Write the thesis first
Shop this pick →

Monitor for charts
See every pane
Shop this pick →
Story playbook
A pre-built map of what to watch — stocks, ETFs, and educational next steps. Not personalized advice.
Snapshot date: November 8, 2026 at 7:36 AM ET
This playbook was built when the story published and is not live-updated. Prices, news, and risk can change after this date — treat it as a starting map, not a current trade ticket.
Story → money map
EV valuation consolidation
Tesla stock has gone almost a year without setting a new all-time high and is trading well below its previous records. Investors are watching to see if historical patterns suggest the stock is ready for another big run or if it will stay stuck in a consolidation range.
What changed
Tesla reached an 11-month drought without a record closing high, prompting technical analysis of historical valuation gaps and volume profiles.
Who wins / who loses
Patient long-term accumulators and technical swing traders benefit from defined risk levels, while momentum chasers risk getting trapped in prolonged consolidation bands.
Time horizon
Think in terms of the next few weeks.
Confidence & best fit
medium confidence · Active trader
Safer theme exposure (ETFs)
Baskets that own the theme without betting on one company.
Single stocks (higher risk)
Primary = closest to the story · Peers = same industry · Second-order = knock-on effects · Avoid = looks related but may be a trap
Primary
- $TSLAWatch — track, don’t rush
The main stock in question; watchers are waiting to see if it can break out of its nearly year-long slump.
View $TSLA chart → · End-of-day delayed data
Peer
- $RIVNStay away — for now
Another electric vehicle maker that often moves in the same direction as Tesla due to overall industry trends.
View $RIVN chart → · End-of-day delayed data
- $LCIDStay away — for now
A smaller electric car company that tends to struggle when the bigger names face prolonged consolidation.
View $LCID chart → · End-of-day delayed data
Options (education only)
No strikes or expiries — a framework for how traders might express the view. Options can expire worthless.
Options are complex financial contracts. Beginners should skip them entirely here and stick to watching the stock chart or using safer ETFs.
See options-friendly brokers →Income / OppHub America angle
Not a trade tip — ways to use the insight outside the market.
- Review personal portfolio exposure to single-stock electric vehicle concentration risk.
What would break this thesis
- A decisive breakdown below key historical support levels or a severe deterioration in macro liquidity.
What to do next on OppHub America
Saved playbooks stay on this device for now.
Important
Not financial advice. OppHub America playbooks are educational market maps only — not recommendations to buy, sell, or hold any security. Markets move fast; information can be wrong or outdated. Trade and invest at your own risk. Do your own research or consult a licensed advisor.
Based on reporting from yahoo-tickers-tape-movers.
Informational and educational only — not investment, financial, or legal advice. Disclosure
Shares a vertical MP4 loop to your phone's camera roll or app share sheet (Instagram, TikTok, Facebook Reels).