Barry, OppHub America Desk · · Source: yahoo-tickers-tape-movers
Unity Software Valuation Analysis: Fair Value vs. $45.68 Close
If Unity Software trades near its $45.68 close relative to the $49.39 fair value threshold, watch $U+WL for continued volume around subscription growth milestones and profit margin trajectory updates.
Based on reporting from yahoo-tickers-tape-movers.
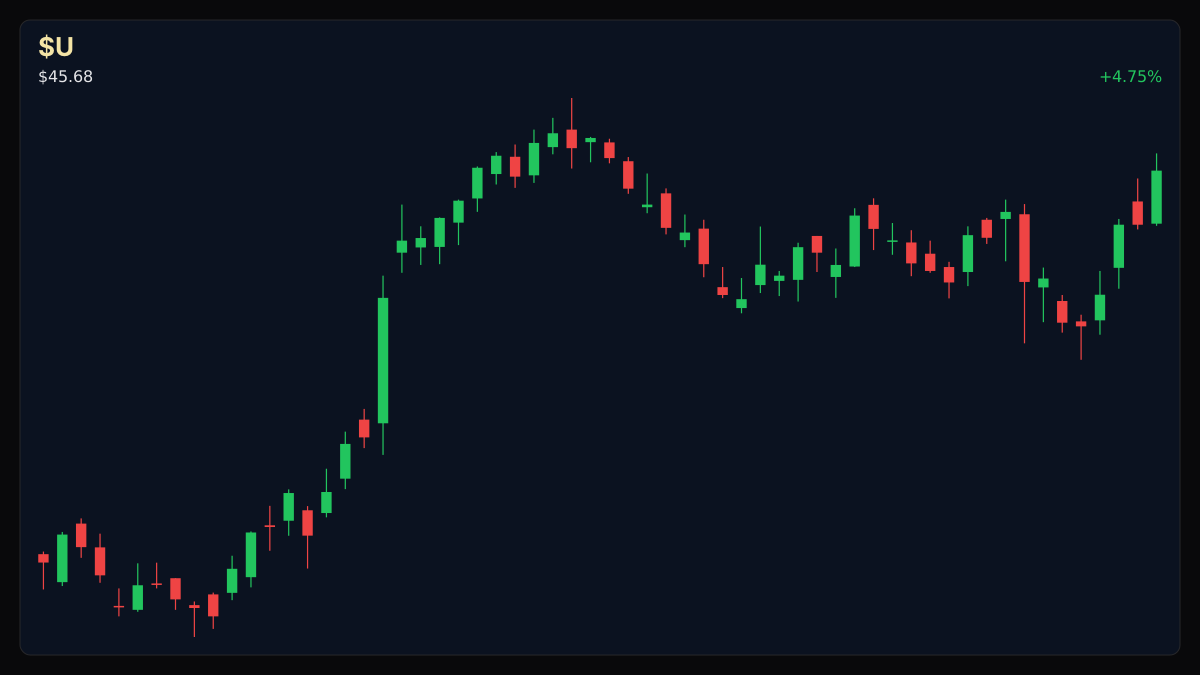
Unity Software (NYSE: U) traded recently at $45.68 against a widely followed fair value estimate of $49.39, drawing attention as analysts project long-term revenue and margin shifts through 2029. Investors are weighing recent multi-month returns against broader five-year historical performance while tracking growth assumptions.
Market context for this story
As of: PremarketLoading quotes…
Informational only — not investment advice. Full markets →
 $U
$U$U
TradingView
Live chart & market data via TradingView · OppHub classroom · Delayed or exchange real-time per TradingView data agreements · Not investment advice
Educational TradingView chart — search any symbol in the widget. Confirm on /markets/U. Not investment advice.
Related markets
Shares a vertical MP4 loop to your phone's camera roll or app share sheet (Instagram, TikTok, Facebook Reels).
Unity Software (NYSE: U) closed at $45.68, positioning the stock near a widely followed fair value estimate of $49.39 built on multi-year growth and margin projections. According to analysts tracking the software provider, forward models factor in a discount rate of 8.86% and anticipated share count expansion of 2.85% annually over the next three years.
### Valuation and Projections Market participants are evaluating projections estimating revenue reaching $3.6 billion and earnings of $989.9 million by 2029, paired with a future price-to-earnings multiple of 30.8x. Underlying assumptions point to a transition from a current loss base of $587.5 million toward profitability, supported by subscription expansion initiatives.
### Share Price Performance Recent performance metrics show a 7-day share price return of 14.6% and a 90-day gain of 54.01%. Over a longer horizon, a 1-year total shareholder return of 21.72% contrasts with a five-year decline of 66.34%, highlighting varied time-frame dynamics for market participants.
### Money Play If Unity Software trades near its $45.68 close relative to the $49.39 fair value threshold, watch $U+WL for continued volume around subscription growth milestones and profit margin trajectory updates.
###
Read the full story
Original reporting and related coverage — attribution links only, not paid recommendations.
Trade this story
 Robinhood
 Webull
 Tradier
 IBKR
IBKR
Chart this story
 TradingView
Broker and exchange buttons use invite / refer-a-friend links (rewards may be capped). Charting links (TradingView) are partner offers that may pay OppHub America a commission at no extra cost to you.
OppSHOP
Full OppSHOP →As an Amazon Associate, OppHub America earns from qualifying purchases. Shopping here helps keep the site free — at no extra cost to you. Disclosure

OppSHOP
Related to this story
If Unity Software trades near its $45.68 close relative to the $49.39 fa
Shop related →

Investing books
Read the classics
Shop this pick →

Personal finance books
Run the household books
Shop this pick →

Trading notebooks
Write the thesis first
Shop this pick →

Monitor for charts
See every pane
Shop this pick →
Story playbook
A pre-built map of what to watch — stocks, ETFs, and educational next steps. Not personalized advice.
Snapshot date: October 6, 2026 at 7:01 AM ET
This playbook was built when the story published and is not live-updated. Prices, news, and risk can change after this date — treat it as a starting map, not a current trade ticket.
Story → money map
software valuation turnaround
Unity Software shares are trading close to an estimated fair value of $49.39 after experiencing a strong price bounce recently. Investors care because the company is trying to turn past losses into profits through subscription growth over the next few years.
What changed
Unity Software shares closed near $45.68, drawing attention as analysts evaluate its path from operating losses to profitability by 2029.
Who wins / who loses
Long-term software growth investors benefit if subscription targets are met, while risk-averse holders remain vulnerable to historical downward volatility.
Time horizon
Think in terms of the next few weeks.
Confidence & best fit
medium confidence · Long-term investor, Active trader
Safer theme exposure (ETFs)
Baskets that own the theme without betting on one company.
Single stocks (higher risk)
Primary = closest to the story · Peers = same industry · Second-order = knock-on effects · Avoid = looks related but may be a trap
Primary
- $UWatch — track, don’t rush
The stock is hovering near its calculated fair price after a big recent price jump, so traders are watching what happens next.
View $U chart → · End-of-day delayed data
Peer
- $APPNWatch — track, don’t rush
Other software companies face similar pressure to prove they can turn a profit.
View $APPN chart → · End-of-day delayed data
Options (education only)
No strikes or expiries — a framework for how traders might express the view. Options can expire worthless.
Beginners should skip options here because the stock's sharp recent price swings make option contracts expensive and unpredictable.
See options-friendly brokers →Income / OppHub America angle
Not a trade tip — ways to use the insight outside the market.
- Study developer adoption metrics for game engine platforms to gauge forward subscription health.
What would break this thesis
- A sharp break below recent support levels or failure to reach projected margin improvement milestones.
What to do next on OppHub America
Saved playbooks stay on this device for now.
Important
Not financial advice. OppHub America playbooks are educational market maps only — not recommendations to buy, sell, or hold any security. Markets move fast; information can be wrong or outdated. Trade and invest at your own risk. Do your own research or consult a licensed advisor.
Based on reporting from yahoo-tickers-tape-movers.
Informational and educational only — not investment, financial, or legal advice. Disclosure
Shares a vertical MP4 loop to your phone's camera roll or app share sheet (Instagram, TikTok, Facebook Reels).