OppHub America Desk · · Source: yahoo-tickers-tape-movers
US Inflation Hits 3.7% in September Amid Cash Flow Focus
As inflation prints at 3.7% amid higher energy costs, market participants focus on cash generation and balance sheet resilience across major operators.
Based on reporting from yahoo-tickers-tape-movers.
Inflation in the United States hit 3.7% in September, driven higher by energy costs as markets navigate a broader tape pullback. The macroeconomic print focuses attention on cash flow generation across major operators amid shifting bond yields and equity breadth.
Market context for this story
As of: WeekendLoading quotes…
Informational only — not investment advice. Full markets →


$SPYSPDR S&P 500 ETF
TradingView
Live chart & market data via TradingView · OppHub classroom · Delayed or exchange real-time per TradingView data agreements · Not investment advice
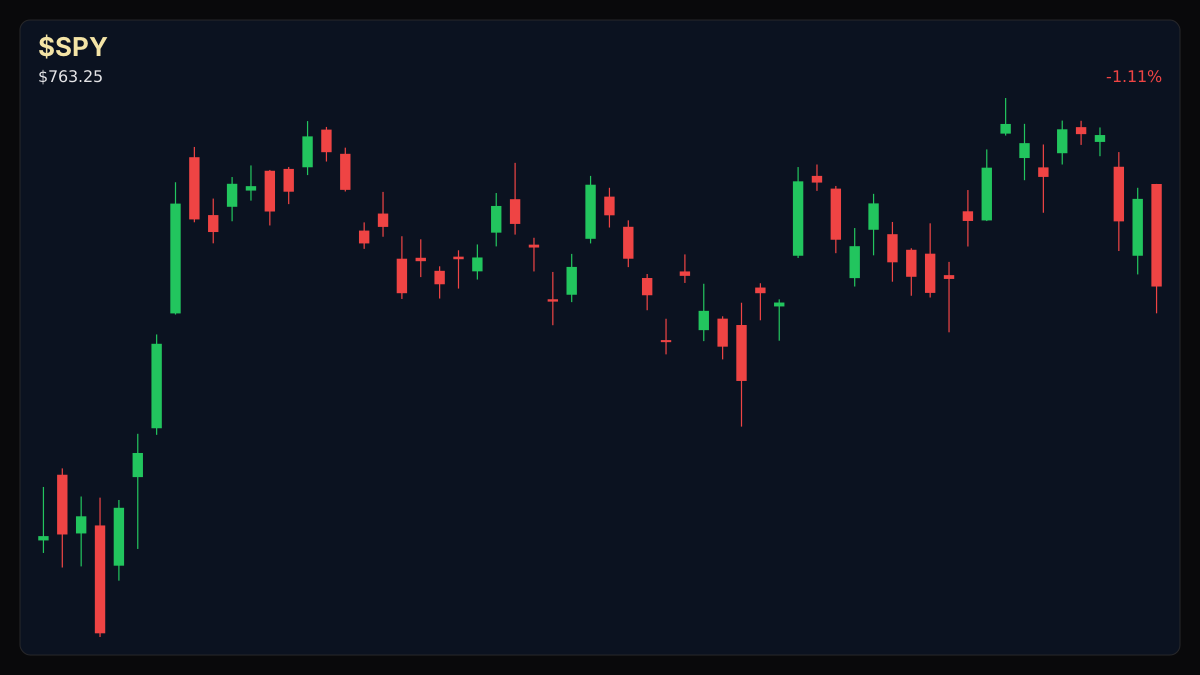
Educational TradingView chart — search any symbol in the widget. Confirm on /markets/SPY and related $GOOGL, $AMZN. Not investment advice.
Related markets
Shares a vertical MP4 loop to your phone's camera roll or app share sheet (Instagram, TikTok, Facebook Reels).
Inflation in the United States hit 3.7% in September, driven hard by energy costs, pushing cash-generating operators into sharper focus as broader equity indices retreat.
### Tape / Session Read U.S. markets closed lower with the S&P 500 declining 1.09% to 7,659.44, the Dow Jones Industrial Average slipping 0.34% to 52,002.41, and the Nasdaq Composite falling 2.14% to 26,140.03. The Russell 2000 dropped 1.66% to 2,721.37. Meanwhile, the 10-Year Treasury bond yield ticked up to 5.10%, and the VIX volatility index surged 21.45% to 19.99.
### Why This Lane Matters With consumer price inflation prints accelerating to 3.7% on energy pressures, market participants are re-pricing risk across equities and fixed income. Heavy cash generators with robust revenue lines, such as Alphabet's Google Services and Google Cloud segments alongside Amazon's retail and AWS operations, face heightened scrutiny as capital costs evolve.
### Money Play - As inflation prints at 3.7% and macroeconomic volatility rises, investors evaluate large-scale operators with durable operating models and substantial cash generation. - No direct ticker vehicles are explicitly featured in the verified earnings tape for execution in this specific macro update, keeping focus on broader index positioning.
## Technical Analysis & Key Risk Watch — Market Tape
The broader equity tape reflects risk-off positioning as bond yields edge higher and volatility expands. Traders watch key index support levels for stabilization following the session pullback.
Read the full story
Original reporting and related coverage — attribution links only, not paid recommendations.
Trade this story
 Robinhood
 Webull
 Tradier
 IBKR
IBKR
Chart this story
 TradingView
Broker and exchange buttons use invite / refer-a-friend links (rewards may be capped). Charting links (TradingView) are partner offers that may pay OppHub America a commission at no extra cost to you.
OppSHOP
Full OppSHOP →As an Amazon Associate, OppHub America earns from qualifying purchases. Shopping here helps keep the site free — at no extra cost to you. Disclosure

OppSHOP
Related to this story
As inflation prints at 3.7% amid higher energy costs, market participant
Shop related →

Investing books
Read the classics
Shop this pick →

Personal finance books
Run the household books
Shop this pick →

Trading notebooks
Write the thesis first
Shop this pick →

Monitor for charts
See every pane
Shop this pick →
Based on reporting from yahoo-tickers-tape-movers.
Informational and educational only — not investment, financial, or legal advice. Disclosure
Shares a vertical MP4 loop to your phone's camera roll or app share sheet (Instagram, TikTok, Facebook Reels).